Immigrants from Bulgaria vs Maltese 10th Grade
COMPARE
Immigrants from Bulgaria
Maltese
10th Grade
10th Grade Comparison
Immigrants from Bulgaria
Maltese
94.6%
10TH GRADE
98.1/ 100
METRIC RATING
98th/ 347
METRIC RANK
95.5%
10TH GRADE
100.0/ 100
METRIC RATING
25th/ 347
METRIC RANK
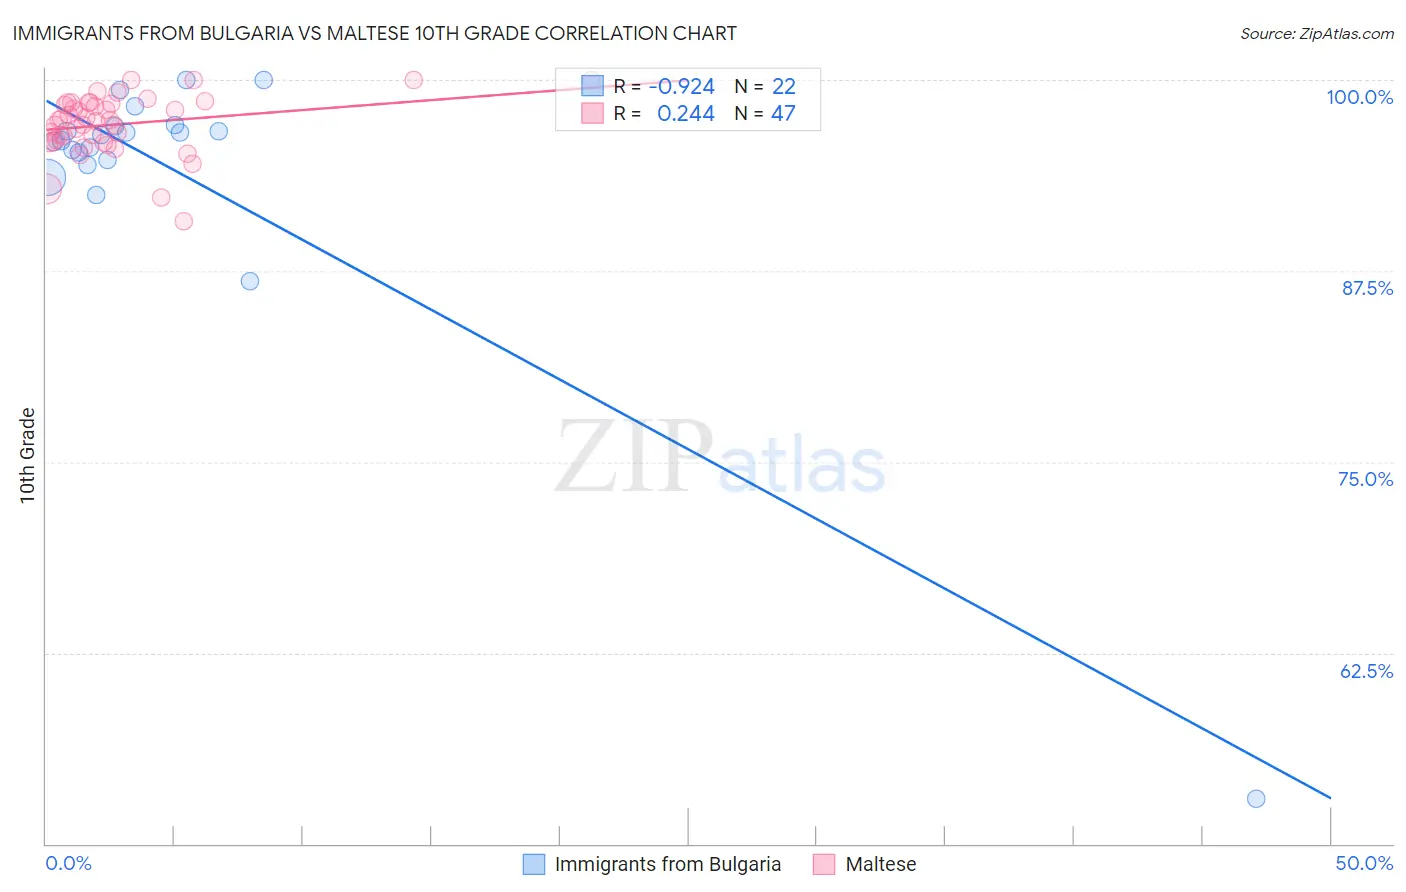
Immigrants from Bulgaria vs Maltese 10th Grade Correlation Chart
The statistical analysis conducted on geographies consisting of 172,552,181 people shows a near-perfect negative correlation between the proportion of Immigrants from Bulgaria and percentage of population with at least 10th grade education in the United States with a correlation coefficient (R) of -0.924 and weighted average of 94.6%. Similarly, the statistical analysis conducted on geographies consisting of 126,475,193 people shows a weak positive correlation between the proportion of Maltese and percentage of population with at least 10th grade education in the United States with a correlation coefficient (R) of 0.244 and weighted average of 95.5%, a difference of 0.97%.
10th Grade Correlation Summary
| Measurement | Immigrants from Bulgaria | Maltese |
| Minimum | 52.9% | 90.8% |
| Maximum | 100.0% | 100.0% |
| Range | 47.1% | 9.2% |
| Mean | 94.0% | 97.1% |
| Median | 96.2% | 97.4% |
| Interquartile 25% (IQ1) | 94.8% | 96.0% |
| Interquartile 75% (IQ3) | 97.0% | 98.5% |
| Interquartile Range (IQR) | 2.2% | 2.6% |
| Standard Deviation (Sample) | 9.6% | 2.0% |
| Standard Deviation (Population) | 9.4% | 1.9% |
Similar Demographics by 10th Grade
Demographics Similar to Immigrants from Bulgaria by 10th Grade
In terms of 10th grade, the demographic groups most similar to Immigrants from Bulgaria are Immigrants from France (94.5%, a difference of 0.020%), Soviet Union (94.6%, a difference of 0.030%), Immigrants from Germany (94.6%, a difference of 0.030%), Menominee (94.6%, a difference of 0.030%), and Immigrants from Switzerland (94.6%, a difference of 0.030%).
| Demographics | Rating | Rank | 10th Grade |
| Whites/Caucasians | 98.8 /100 | #91 | Exceptional 94.7% |
| Yugoslavians | 98.4 /100 | #92 | Exceptional 94.6% |
| Soviet Union | 98.3 /100 | #93 | Exceptional 94.6% |
| Immigrants | Germany | 98.3 /100 | #94 | Exceptional 94.6% |
| Menominee | 98.3 /100 | #95 | Exceptional 94.6% |
| Immigrants | Switzerland | 98.3 /100 | #96 | Exceptional 94.6% |
| Lebanese | 98.3 /100 | #97 | Exceptional 94.6% |
| Immigrants | Bulgaria | 98.1 /100 | #98 | Exceptional 94.6% |
| Immigrants | France | 97.9 /100 | #99 | Exceptional 94.5% |
| Immigrants | South Central Asia | 97.8 /100 | #100 | Exceptional 94.5% |
| Syrians | 97.7 /100 | #101 | Exceptional 94.5% |
| Cambodians | 97.6 /100 | #102 | Exceptional 94.5% |
| Immigrants | Europe | 97.5 /100 | #103 | Exceptional 94.5% |
| Immigrants | Romania | 97.5 /100 | #104 | Exceptional 94.5% |
| Immigrants | Turkey | 97.4 /100 | #105 | Exceptional 94.5% |
Demographics Similar to Maltese by 10th Grade
In terms of 10th grade, the demographic groups most similar to Maltese are European (95.5%, a difference of 0.0%), Czech (95.5%, a difference of 0.020%), Welsh (95.5%, a difference of 0.020%), Eastern European (95.5%, a difference of 0.030%), and Alaskan Athabascan (95.4%, a difference of 0.040%).
| Demographics | Rating | Rank | 10th Grade |
| Italians | 100.0 /100 | #18 | Exceptional 95.6% |
| Scandinavians | 100.0 /100 | #19 | Exceptional 95.6% |
| Chinese | 100.0 /100 | #20 | Exceptional 95.5% |
| Dutch | 100.0 /100 | #21 | Exceptional 95.5% |
| Eastern Europeans | 100.0 /100 | #22 | Exceptional 95.5% |
| Czechs | 100.0 /100 | #23 | Exceptional 95.5% |
| Europeans | 100.0 /100 | #24 | Exceptional 95.5% |
| Maltese | 100.0 /100 | #25 | Exceptional 95.5% |
| Welsh | 100.0 /100 | #26 | Exceptional 95.5% |
| Alaskan Athabascans | 100.0 /100 | #27 | Exceptional 95.4% |
| Luxembourgers | 100.0 /100 | #28 | Exceptional 95.4% |
| Bulgarians | 100.0 /100 | #29 | Exceptional 95.4% |
| Belgians | 100.0 /100 | #30 | Exceptional 95.4% |
| Iranians | 100.0 /100 | #31 | Exceptional 95.3% |
| Hungarians | 100.0 /100 | #32 | Exceptional 95.3% |