Immigrants from Latvia vs Hawaiian 5th Grade
COMPARE
Immigrants from Latvia
Hawaiian
5th Grade
5th Grade Comparison
Immigrants from Latvia
Hawaiians
97.7%
5TH GRADE
97.1/ 100
METRIC RATING
109th/ 347
METRIC RANK
97.2%
5TH GRADE
25.6/ 100
METRIC RATING
196th/ 347
METRIC RANK
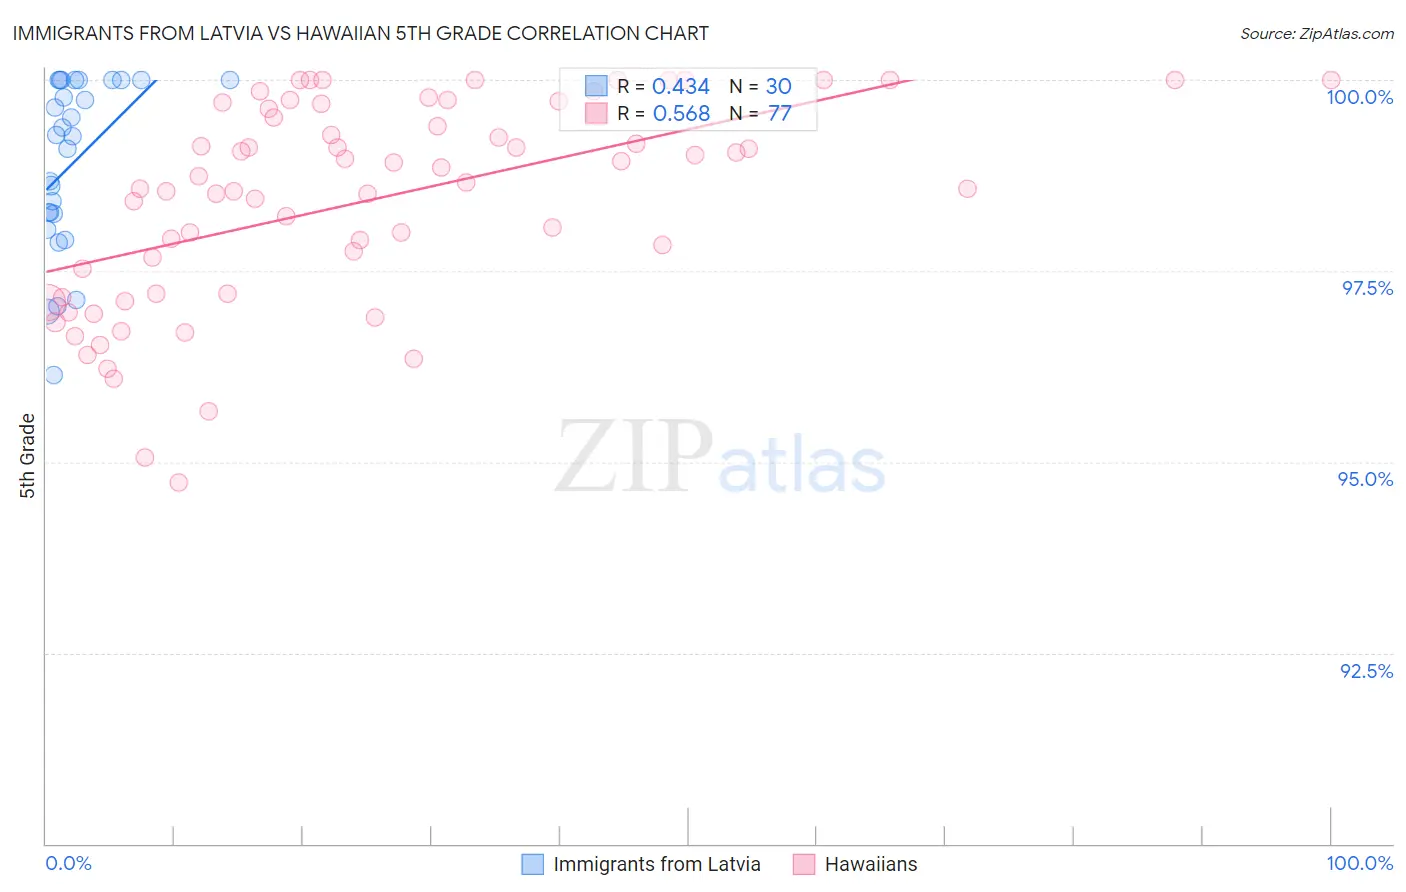
Immigrants from Latvia vs Hawaiian 5th Grade Correlation Chart
The statistical analysis conducted on geographies consisting of 113,724,291 people shows a moderate positive correlation between the proportion of Immigrants from Latvia and percentage of population with at least 5th grade education in the United States with a correlation coefficient (R) of 0.434 and weighted average of 97.7%. Similarly, the statistical analysis conducted on geographies consisting of 327,621,279 people shows a substantial positive correlation between the proportion of Hawaiians and percentage of population with at least 5th grade education in the United States with a correlation coefficient (R) of 0.568 and weighted average of 97.2%, a difference of 0.48%.
5th Grade Correlation Summary
| Measurement | Immigrants from Latvia | Hawaiian |
| Minimum | 96.1% | 94.7% |
| Maximum | 100.0% | 100.0% |
| Range | 3.9% | 5.3% |
| Mean | 98.9% | 98.4% |
| Median | 99.3% | 98.7% |
| Interquartile 25% (IQ1) | 98.3% | 97.2% |
| Interquartile 75% (IQ3) | 100.0% | 99.7% |
| Interquartile Range (IQR) | 1.7% | 2.5% |
| Standard Deviation (Sample) | 1.1% | 1.3% |
| Standard Deviation (Population) | 1.1% | 1.3% |
Similar Demographics by 5th Grade
Demographics Similar to Immigrants from Latvia by 5th Grade
In terms of 5th grade, the demographic groups most similar to Immigrants from Latvia are Nonimmigrants (97.7%, a difference of 0.010%), Thai (97.7%, a difference of 0.010%), Bhutanese (97.7%, a difference of 0.020%), Immigrants from Czechoslovakia (97.7%, a difference of 0.020%), and Immigrants from Singapore (97.7%, a difference of 0.020%).
| Demographics | Rating | Rank | 5th Grade |
| Choctaw | 98.0 /100 | #102 | Exceptional 97.7% |
| Cheyenne | 97.9 /100 | #103 | Exceptional 97.7% |
| German Russians | 97.8 /100 | #104 | Exceptional 97.7% |
| Bhutanese | 97.6 /100 | #105 | Exceptional 97.7% |
| Immigrants | Czechoslovakia | 97.5 /100 | #106 | Exceptional 97.7% |
| Immigrants | Singapore | 97.5 /100 | #107 | Exceptional 97.7% |
| Immigrants | Nonimmigrants | 97.3 /100 | #108 | Exceptional 97.7% |
| Immigrants | Latvia | 97.1 /100 | #109 | Exceptional 97.7% |
| Thais | 96.9 /100 | #110 | Exceptional 97.7% |
| Menominee | 96.3 /100 | #111 | Exceptional 97.7% |
| Immigrants | Switzerland | 96.0 /100 | #112 | Exceptional 97.7% |
| Iroquois | 95.9 /100 | #113 | Exceptional 97.7% |
| Lebanese | 95.7 /100 | #114 | Exceptional 97.6% |
| Okinawans | 95.7 /100 | #115 | Exceptional 97.6% |
| Immigrants | Croatia | 95.5 /100 | #116 | Exceptional 97.6% |
Demographics Similar to Hawaiians by 5th Grade
In terms of 5th grade, the demographic groups most similar to Hawaiians are Brazilian (97.2%, a difference of 0.0%), Guamanian/Chamorro (97.2%, a difference of 0.010%), Navajo (97.2%, a difference of 0.020%), Immigrants from Albania (97.2%, a difference of 0.020%), and Black/African American (97.3%, a difference of 0.030%).
| Demographics | Rating | Rank | 5th Grade |
| Immigrants | Egypt | 32.9 /100 | #189 | Fair 97.3% |
| Blacks/African Americans | 31.8 /100 | #190 | Fair 97.3% |
| Immigrants | Brazil | 31.5 /100 | #191 | Fair 97.3% |
| Panamanians | 31.3 /100 | #192 | Fair 97.3% |
| Navajo | 29.0 /100 | #193 | Fair 97.2% |
| Immigrants | Albania | 28.5 /100 | #194 | Fair 97.2% |
| Guamanians/Chamorros | 26.8 /100 | #195 | Fair 97.2% |
| Hawaiians | 25.6 /100 | #196 | Fair 97.2% |
| Brazilians | 25.4 /100 | #197 | Fair 97.2% |
| Immigrants | Uganda | 21.1 /100 | #198 | Fair 97.2% |
| Natives/Alaskans | 18.0 /100 | #199 | Poor 97.2% |
| Immigrants | Northern Africa | 16.8 /100 | #200 | Poor 97.2% |
| Immigrants | Chile | 16.6 /100 | #201 | Poor 97.2% |
| Africans | 15.3 /100 | #202 | Poor 97.2% |
| Immigrants | Bahamas | 14.9 /100 | #203 | Poor 97.2% |