Polish vs French Canadian 12th Grade, No Diploma
COMPARE
Polish
French Canadian
12th Grade, No Diploma
12th Grade, No Diploma Comparison
Poles
French Canadians
93.5%
12TH GRADE, NO DIPLOMA
100.0/ 100
METRIC RATING
11th/ 347
METRIC RANK
92.6%
12TH GRADE, NO DIPLOMA
99.3/ 100
METRIC RATING
80th/ 347
METRIC RANK
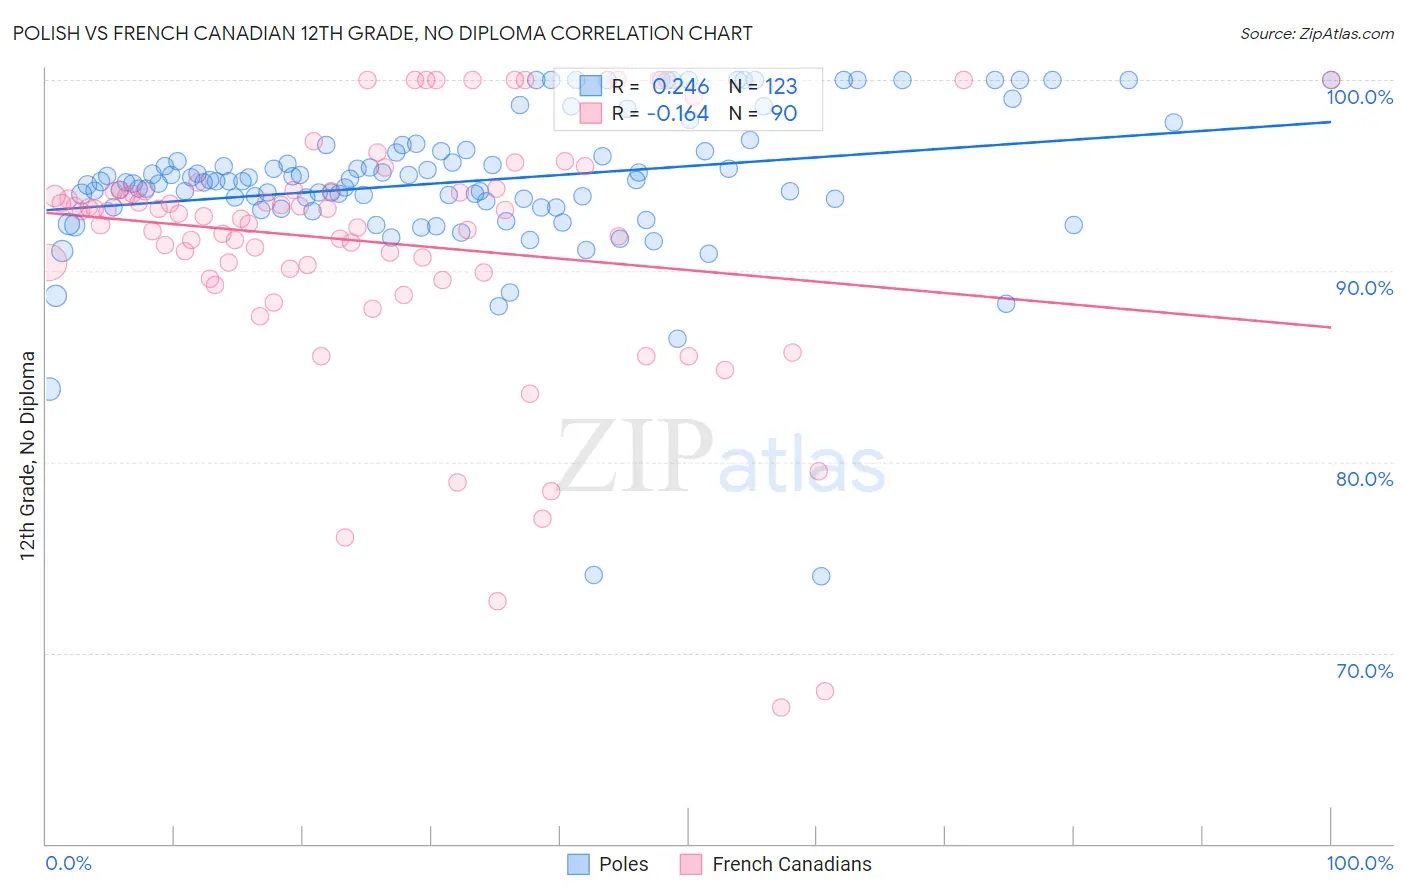
Polish vs French Canadian 12th Grade, No Diploma Correlation Chart
The statistical analysis conducted on geographies consisting of 560,594,421 people shows a weak positive correlation between the proportion of Poles and percentage of population with at least 12th grade (no diploma) education in the United States with a correlation coefficient (R) of 0.246 and weighted average of 93.5%. Similarly, the statistical analysis conducted on geographies consisting of 502,678,956 people shows a poor negative correlation between the proportion of French Canadians and percentage of population with at least 12th grade (no diploma) education in the United States with a correlation coefficient (R) of -0.164 and weighted average of 92.6%, a difference of 1.0%.
12th Grade, No Diploma Correlation Summary
| Measurement | Polish | French Canadian |
| Minimum | 74.0% | 67.1% |
| Maximum | 100.0% | 100.0% |
| Range | 26.0% | 32.9% |
| Mean | 94.7% | 91.5% |
| Median | 94.7% | 93.0% |
| Interquartile 25% (IQ1) | 93.3% | 90.1% |
| Interquartile 75% (IQ3) | 96.4% | 94.2% |
| Interquartile Range (IQR) | 3.0% | 4.1% |
| Standard Deviation (Sample) | 4.1% | 6.6% |
| Standard Deviation (Population) | 4.1% | 6.6% |
Similar Demographics by 12th Grade, No Diploma
Demographics Similar to Poles by 12th Grade, No Diploma
In terms of 12th grade, no diploma, the demographic groups most similar to Poles are Eastern European (93.5%, a difference of 0.010%), Danish (93.5%, a difference of 0.030%), Bulgarian (93.5%, a difference of 0.050%), Croatian (93.5%, a difference of 0.060%), and Latvian (93.6%, a difference of 0.080%).
| Demographics | Rating | Rank | 12th Grade, No Diploma |
| Slovenes | 100.0 /100 | #4 | Exceptional 93.6% |
| Carpatho Rusyns | 100.0 /100 | #5 | Exceptional 93.6% |
| Immigrants | India | 100.0 /100 | #6 | Exceptional 93.6% |
| Slovaks | 100.0 /100 | #7 | Exceptional 93.6% |
| Chinese | 100.0 /100 | #8 | Exceptional 93.6% |
| Latvians | 100.0 /100 | #9 | Exceptional 93.6% |
| Croatians | 100.0 /100 | #10 | Exceptional 93.5% |
| Poles | 100.0 /100 | #11 | Exceptional 93.5% |
| Eastern Europeans | 100.0 /100 | #12 | Exceptional 93.5% |
| Danes | 100.0 /100 | #13 | Exceptional 93.5% |
| Bulgarians | 100.0 /100 | #14 | Exceptional 93.5% |
| Finns | 100.0 /100 | #15 | Exceptional 93.4% |
| Maltese | 100.0 /100 | #16 | Exceptional 93.3% |
| Luxembourgers | 100.0 /100 | #17 | Exceptional 93.3% |
| Immigrants | Singapore | 99.9 /100 | #18 | Exceptional 93.3% |
Demographics Similar to French Canadians by 12th Grade, No Diploma
In terms of 12th grade, no diploma, the demographic groups most similar to French Canadians are Romanian (92.6%, a difference of 0.010%), Cambodian (92.6%, a difference of 0.020%), Immigrants from Denmark (92.5%, a difference of 0.020%), Immigrants from Switzerland (92.5%, a difference of 0.020%), and Immigrants from Israel (92.5%, a difference of 0.030%).
| Demographics | Rating | Rank | 12th Grade, No Diploma |
| Burmese | 99.4 /100 | #73 | Exceptional 92.6% |
| Immigrants | Moldova | 99.4 /100 | #74 | Exceptional 92.6% |
| Native Hawaiians | 99.4 /100 | #75 | Exceptional 92.6% |
| French | 99.4 /100 | #76 | Exceptional 92.6% |
| Immigrants | England | 99.4 /100 | #77 | Exceptional 92.6% |
| Cambodians | 99.3 /100 | #78 | Exceptional 92.6% |
| Romanians | 99.3 /100 | #79 | Exceptional 92.6% |
| French Canadians | 99.3 /100 | #80 | Exceptional 92.6% |
| Immigrants | Denmark | 99.2 /100 | #81 | Exceptional 92.5% |
| Immigrants | Switzerland | 99.2 /100 | #82 | Exceptional 92.5% |
| Immigrants | Israel | 99.2 /100 | #83 | Exceptional 92.5% |
| Immigrants | Bulgaria | 99.1 /100 | #84 | Exceptional 92.5% |
| Immigrants | Saudi Arabia | 99.0 /100 | #85 | Exceptional 92.5% |
| Immigrants | Turkey | 98.9 /100 | #86 | Exceptional 92.4% |
| Immigrants | France | 98.8 /100 | #87 | Exceptional 92.4% |