Malaysian vs French Canadian 12th Grade, No Diploma
COMPARE
Malaysian
French Canadian
12th Grade, No Diploma
12th Grade, No Diploma Comparison
Malaysians
French Canadians
89.2%
12TH GRADE, NO DIPLOMA
0.1/ 100
METRIC RATING
272nd/ 347
METRIC RANK
92.6%
12TH GRADE, NO DIPLOMA
99.3/ 100
METRIC RATING
80th/ 347
METRIC RANK
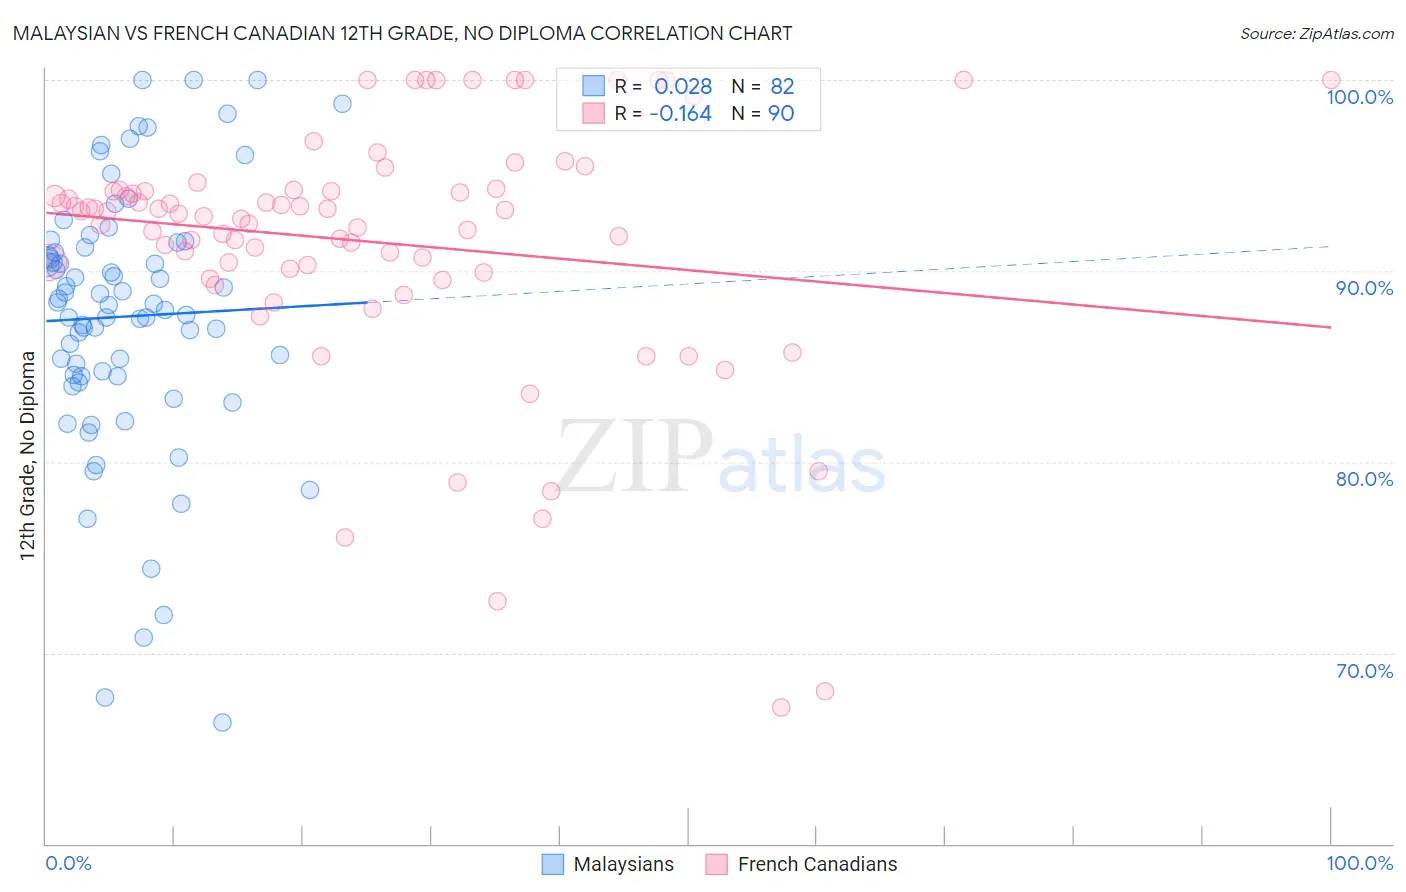
Malaysian vs French Canadian 12th Grade, No Diploma Correlation Chart
The statistical analysis conducted on geographies consisting of 226,109,984 people shows no correlation between the proportion of Malaysians and percentage of population with at least 12th grade (no diploma) education in the United States with a correlation coefficient (R) of 0.028 and weighted average of 89.2%. Similarly, the statistical analysis conducted on geographies consisting of 502,678,956 people shows a poor negative correlation between the proportion of French Canadians and percentage of population with at least 12th grade (no diploma) education in the United States with a correlation coefficient (R) of -0.164 and weighted average of 92.6%, a difference of 3.7%.
12th Grade, No Diploma Correlation Summary
| Measurement | Malaysian | French Canadian |
| Minimum | 66.4% | 67.1% |
| Maximum | 100.0% | 100.0% |
| Range | 33.6% | 32.9% |
| Mean | 87.6% | 91.5% |
| Median | 88.2% | 93.0% |
| Interquartile 25% (IQ1) | 84.5% | 90.1% |
| Interquartile 75% (IQ3) | 91.2% | 94.2% |
| Interquartile Range (IQR) | 6.7% | 4.1% |
| Standard Deviation (Sample) | 6.9% | 6.6% |
| Standard Deviation (Population) | 6.8% | 6.6% |
Similar Demographics by 12th Grade, No Diploma
Demographics Similar to Malaysians by 12th Grade, No Diploma
In terms of 12th grade, no diploma, the demographic groups most similar to Malaysians are Black/African American (89.3%, a difference of 0.010%), Bangladeshi (89.3%, a difference of 0.020%), U.S. Virgin Islander (89.3%, a difference of 0.060%), Immigrants from Trinidad and Tobago (89.3%, a difference of 0.10%), and Seminole (89.4%, a difference of 0.12%).
| Demographics | Rating | Rank | 12th Grade, No Diploma |
| Trinidadians and Tobagonians | 0.2 /100 | #265 | Tragic 89.4% |
| Seminole | 0.2 /100 | #266 | Tragic 89.4% |
| West Indians | 0.2 /100 | #267 | Tragic 89.3% |
| Immigrants | Trinidad and Tobago | 0.1 /100 | #268 | Tragic 89.3% |
| U.S. Virgin Islanders | 0.1 /100 | #269 | Tragic 89.3% |
| Bangladeshis | 0.1 /100 | #270 | Tragic 89.3% |
| Blacks/African Americans | 0.1 /100 | #271 | Tragic 89.3% |
| Malaysians | 0.1 /100 | #272 | Tragic 89.2% |
| Barbadians | 0.1 /100 | #273 | Tragic 89.1% |
| Cajuns | 0.1 /100 | #274 | Tragic 89.1% |
| Immigrants | Congo | 0.1 /100 | #275 | Tragic 89.0% |
| Ute | 0.1 /100 | #276 | Tragic 89.0% |
| Immigrants | Barbados | 0.0 /100 | #277 | Tragic 89.0% |
| Immigrants | St. Vincent and the Grenadines | 0.0 /100 | #278 | Tragic 88.9% |
| Immigrants | Laos | 0.0 /100 | #279 | Tragic 88.9% |
Demographics Similar to French Canadians by 12th Grade, No Diploma
In terms of 12th grade, no diploma, the demographic groups most similar to French Canadians are Romanian (92.6%, a difference of 0.010%), Cambodian (92.6%, a difference of 0.020%), Immigrants from Denmark (92.5%, a difference of 0.020%), Immigrants from Switzerland (92.5%, a difference of 0.020%), and Immigrants from Israel (92.5%, a difference of 0.030%).
| Demographics | Rating | Rank | 12th Grade, No Diploma |
| Burmese | 99.4 /100 | #73 | Exceptional 92.6% |
| Immigrants | Moldova | 99.4 /100 | #74 | Exceptional 92.6% |
| Native Hawaiians | 99.4 /100 | #75 | Exceptional 92.6% |
| French | 99.4 /100 | #76 | Exceptional 92.6% |
| Immigrants | England | 99.4 /100 | #77 | Exceptional 92.6% |
| Cambodians | 99.3 /100 | #78 | Exceptional 92.6% |
| Romanians | 99.3 /100 | #79 | Exceptional 92.6% |
| French Canadians | 99.3 /100 | #80 | Exceptional 92.6% |
| Immigrants | Denmark | 99.2 /100 | #81 | Exceptional 92.5% |
| Immigrants | Switzerland | 99.2 /100 | #82 | Exceptional 92.5% |
| Immigrants | Israel | 99.2 /100 | #83 | Exceptional 92.5% |
| Immigrants | Bulgaria | 99.1 /100 | #84 | Exceptional 92.5% |
| Immigrants | Saudi Arabia | 99.0 /100 | #85 | Exceptional 92.5% |
| Immigrants | Turkey | 98.9 /100 | #86 | Exceptional 92.4% |
| Immigrants | France | 98.8 /100 | #87 | Exceptional 92.4% |