Immigrants from Caribbean vs Lumbee 10th Grade
COMPARE
Immigrants from Caribbean
Lumbee
10th Grade
10th Grade Comparison
Immigrants from Caribbean
Lumbee
90.6%
10TH GRADE
0.0/ 100
METRIC RATING
315th/ 347
METRIC RANK
91.7%
10TH GRADE
0.0/ 100
METRIC RATING
295th/ 347
METRIC RANK
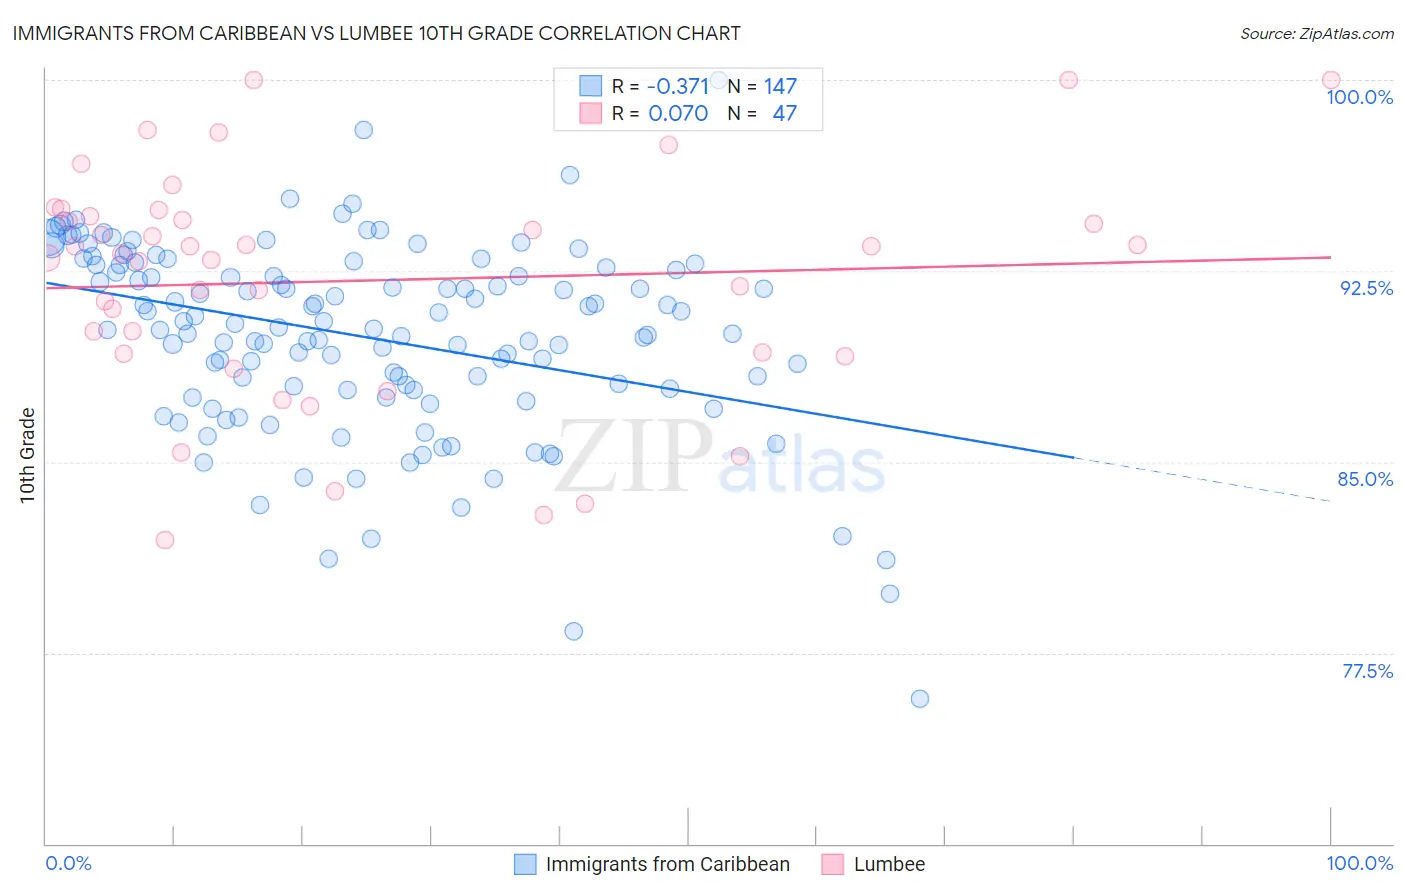
Immigrants from Caribbean vs Lumbee 10th Grade Correlation Chart
The statistical analysis conducted on geographies consisting of 450,064,654 people shows a mild negative correlation between the proportion of Immigrants from Caribbean and percentage of population with at least 10th grade education in the United States with a correlation coefficient (R) of -0.371 and weighted average of 90.6%. Similarly, the statistical analysis conducted on geographies consisting of 92,299,110 people shows a slight positive correlation between the proportion of Lumbee and percentage of population with at least 10th grade education in the United States with a correlation coefficient (R) of 0.070 and weighted average of 91.7%, a difference of 1.3%.
10th Grade Correlation Summary
| Measurement | Immigrants from Caribbean | Lumbee |
| Minimum | 75.7% | 81.9% |
| Maximum | 100.0% | 100.0% |
| Range | 24.3% | 18.1% |
| Mean | 89.9% | 92.1% |
| Median | 90.3% | 93.2% |
| Interquartile 25% (IQ1) | 87.8% | 89.2% |
| Interquartile 75% (IQ3) | 92.7% | 94.7% |
| Interquartile Range (IQR) | 4.9% | 5.4% |
| Standard Deviation (Sample) | 3.8% | 4.5% |
| Standard Deviation (Population) | 3.8% | 4.4% |
Demographics Similar to Immigrants from Caribbean and Lumbee by 10th Grade
In terms of 10th grade, the demographic groups most similar to Immigrants from Caribbean are Nepalese (90.7%, a difference of 0.080%), Cape Verdean (90.8%, a difference of 0.16%), Immigrants from Portugal (90.8%, a difference of 0.19%), Immigrants from Cambodia (90.9%, a difference of 0.35%), and Vietnamese (90.9%, a difference of 0.37%). Similarly, the demographic groups most similar to Lumbee are Immigrants from Grenada (91.6%, a difference of 0.13%), Fijian (91.5%, a difference of 0.27%), Cuban (91.5%, a difference of 0.29%), Immigrants from Haiti (91.4%, a difference of 0.37%), and Guyanese (91.4%, a difference of 0.42%).
| Demographics | Rating | Rank | 10th Grade |
| Lumbee | 0.0 /100 | #295 | Tragic 91.7% |
| Immigrants | Grenada | 0.0 /100 | #296 | Tragic 91.6% |
| Fijians | 0.0 /100 | #297 | Tragic 91.5% |
| Cubans | 0.0 /100 | #298 | Tragic 91.5% |
| Immigrants | Haiti | 0.0 /100 | #299 | Tragic 91.4% |
| Guyanese | 0.0 /100 | #300 | Tragic 91.4% |
| Japanese | 0.0 /100 | #301 | Tragic 91.2% |
| Immigrants | Guyana | 0.0 /100 | #302 | Tragic 91.2% |
| Immigrants | Vietnam | 0.0 /100 | #303 | Tragic 91.2% |
| Pima | 0.0 /100 | #304 | Tragic 91.2% |
| Immigrants | Dominica | 0.0 /100 | #305 | Tragic 91.1% |
| Yaqui | 0.0 /100 | #306 | Tragic 91.1% |
| Immigrants | Fiji | 0.0 /100 | #307 | Tragic 91.0% |
| Immigrants | Bangladesh | 0.0 /100 | #308 | Tragic 91.0% |
| Immigrants | Immigrants | 0.0 /100 | #309 | Tragic 91.0% |
| Vietnamese | 0.0 /100 | #310 | Tragic 90.9% |
| Immigrants | Cambodia | 0.0 /100 | #311 | Tragic 90.9% |
| Immigrants | Portugal | 0.0 /100 | #312 | Tragic 90.8% |
| Cape Verdeans | 0.0 /100 | #313 | Tragic 90.8% |
| Nepalese | 0.0 /100 | #314 | Tragic 90.7% |
| Immigrants | Caribbean | 0.0 /100 | #315 | Tragic 90.6% |