Immigrants from Lebanon vs Immigrants from Cameroon Bachelor's Degree
COMPARE
Immigrants from Lebanon
Immigrants from Cameroon
Bachelor's Degree
Bachelor's Degree Comparison
Immigrants from Lebanon
Immigrants from Cameroon
42.4%
BACHELOR'S DEGREE
99.3/ 100
METRIC RATING
79th/ 347
METRIC RANK
37.7%
BACHELOR'S DEGREE
46.8/ 100
METRIC RATING
178th/ 347
METRIC RANK
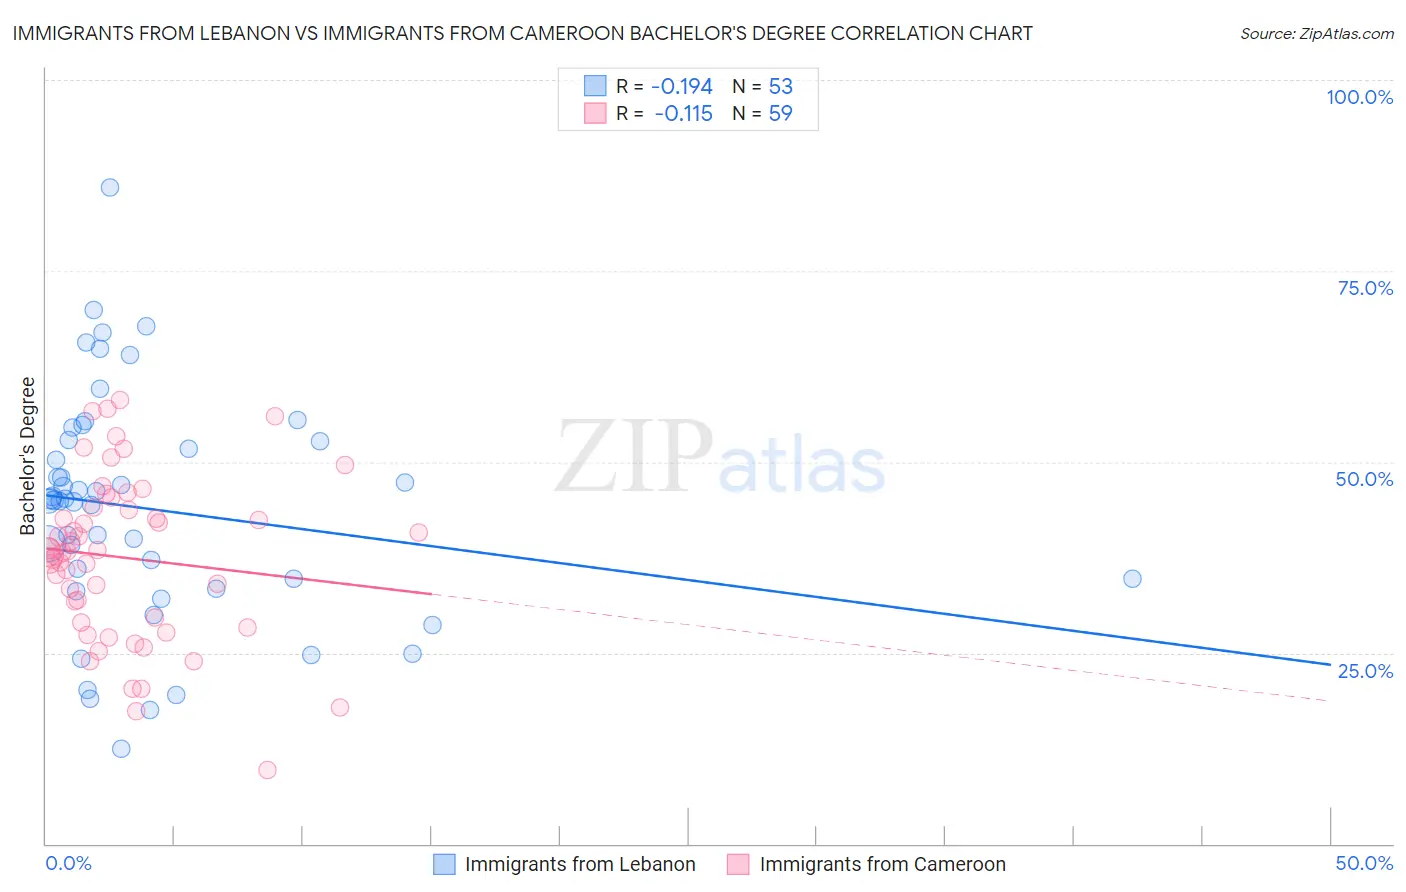
Immigrants from Lebanon vs Immigrants from Cameroon Bachelor's Degree Correlation Chart
The statistical analysis conducted on geographies consisting of 217,160,107 people shows a poor negative correlation between the proportion of Immigrants from Lebanon and percentage of population with at least bachelor's degree education in the United States with a correlation coefficient (R) of -0.194 and weighted average of 42.4%. Similarly, the statistical analysis conducted on geographies consisting of 130,767,721 people shows a poor negative correlation between the proportion of Immigrants from Cameroon and percentage of population with at least bachelor's degree education in the United States with a correlation coefficient (R) of -0.115 and weighted average of 37.7%, a difference of 12.4%.
Bachelor's Degree Correlation Summary
| Measurement | Immigrants from Lebanon | Immigrants from Cameroon |
| Minimum | 12.4% | 9.6% |
| Maximum | 86.0% | 58.0% |
| Range | 73.5% | 48.4% |
| Mean | 43.8% | 37.4% |
| Median | 45.0% | 38.2% |
| Interquartile 25% (IQ1) | 34.0% | 28.9% |
| Interquartile 75% (IQ3) | 52.8% | 44.1% |
| Interquartile Range (IQR) | 18.8% | 15.1% |
| Standard Deviation (Sample) | 15.0% | 10.7% |
| Standard Deviation (Population) | 14.8% | 10.6% |
Similar Demographics by Bachelor's Degree
Demographics Similar to Immigrants from Lebanon by Bachelor's Degree
In terms of bachelor's degree, the demographic groups most similar to Immigrants from Lebanon are Immigrants from Ethiopia (42.5%, a difference of 0.17%), Immigrants from Croatia (42.3%, a difference of 0.20%), Immigrants from Hungary (42.3%, a difference of 0.21%), Immigrants from Eastern Europe (42.5%, a difference of 0.23%), and Immigrants from Scotland (42.3%, a difference of 0.28%).
| Demographics | Rating | Rank | Bachelor's Degree |
| Ethiopians | 99.5 /100 | #72 | Exceptional 42.8% |
| Immigrants | Uzbekistan | 99.5 /100 | #73 | Exceptional 42.8% |
| Bhutanese | 99.5 /100 | #74 | Exceptional 42.7% |
| Immigrants | Zimbabwe | 99.4 /100 | #75 | Exceptional 42.6% |
| Immigrants | Egypt | 99.4 /100 | #76 | Exceptional 42.6% |
| Immigrants | Eastern Europe | 99.4 /100 | #77 | Exceptional 42.5% |
| Immigrants | Ethiopia | 99.4 /100 | #78 | Exceptional 42.5% |
| Immigrants | Lebanon | 99.3 /100 | #79 | Exceptional 42.4% |
| Immigrants | Croatia | 99.2 /100 | #80 | Exceptional 42.3% |
| Immigrants | Hungary | 99.2 /100 | #81 | Exceptional 42.3% |
| Immigrants | Scotland | 99.2 /100 | #82 | Exceptional 42.3% |
| Armenians | 99.2 /100 | #83 | Exceptional 42.3% |
| Immigrants | Western Asia | 99.2 /100 | #84 | Exceptional 42.3% |
| Lithuanians | 99.2 /100 | #85 | Exceptional 42.2% |
| Immigrants | Brazil | 99.2 /100 | #86 | Exceptional 42.2% |
Demographics Similar to Immigrants from Cameroon by Bachelor's Degree
In terms of bachelor's degree, the demographic groups most similar to Immigrants from Cameroon are Basque (37.7%, a difference of 0.060%), Costa Rican (37.7%, a difference of 0.080%), Immigrants from Colombia (37.7%, a difference of 0.13%), Immigrants from Uruguay (37.8%, a difference of 0.15%), and Irish (37.6%, a difference of 0.24%).
| Demographics | Rating | Rank | Bachelor's Degree |
| Bermudans | 54.2 /100 | #171 | Average 38.0% |
| Immigrants | Somalia | 52.8 /100 | #172 | Average 37.9% |
| Immigrants | Iraq | 52.5 /100 | #173 | Average 37.9% |
| Immigrants | Bangladesh | 50.0 /100 | #174 | Average 37.8% |
| Immigrants | Uruguay | 48.3 /100 | #175 | Average 37.8% |
| Costa Ricans | 47.6 /100 | #176 | Average 37.7% |
| Basques | 47.4 /100 | #177 | Average 37.7% |
| Immigrants | Cameroon | 46.8 /100 | #178 | Average 37.7% |
| Immigrants | Colombia | 45.4 /100 | #179 | Average 37.7% |
| Irish | 44.3 /100 | #180 | Average 37.6% |
| Immigrants | Senegal | 43.8 /100 | #181 | Average 37.6% |
| Immigrants | Bosnia and Herzegovina | 43.4 /100 | #182 | Average 37.6% |
| Senegalese | 42.2 /100 | #183 | Average 37.5% |
| Scandinavians | 41.7 /100 | #184 | Average 37.5% |
| Immigrants | Peru | 41.3 /100 | #185 | Average 37.5% |