Immigrants from Canada vs Assyrian/Chaldean/Syriac College, 1 year or more
COMPARE
Immigrants from Canada
Assyrian/Chaldean/Syriac
College, 1 year or more
College, 1 year or more Comparison
Immigrants from Canada
Assyrians/Chaldeans/Syriacs
63.1%
COLLEGE, 1 YEAR OR MORE
99.1/ 100
METRIC RATING
71st/ 347
METRIC RANK
61.5%
COLLEGE, 1 YEAR OR MORE
93.3/ 100
METRIC RATING
119th/ 347
METRIC RANK
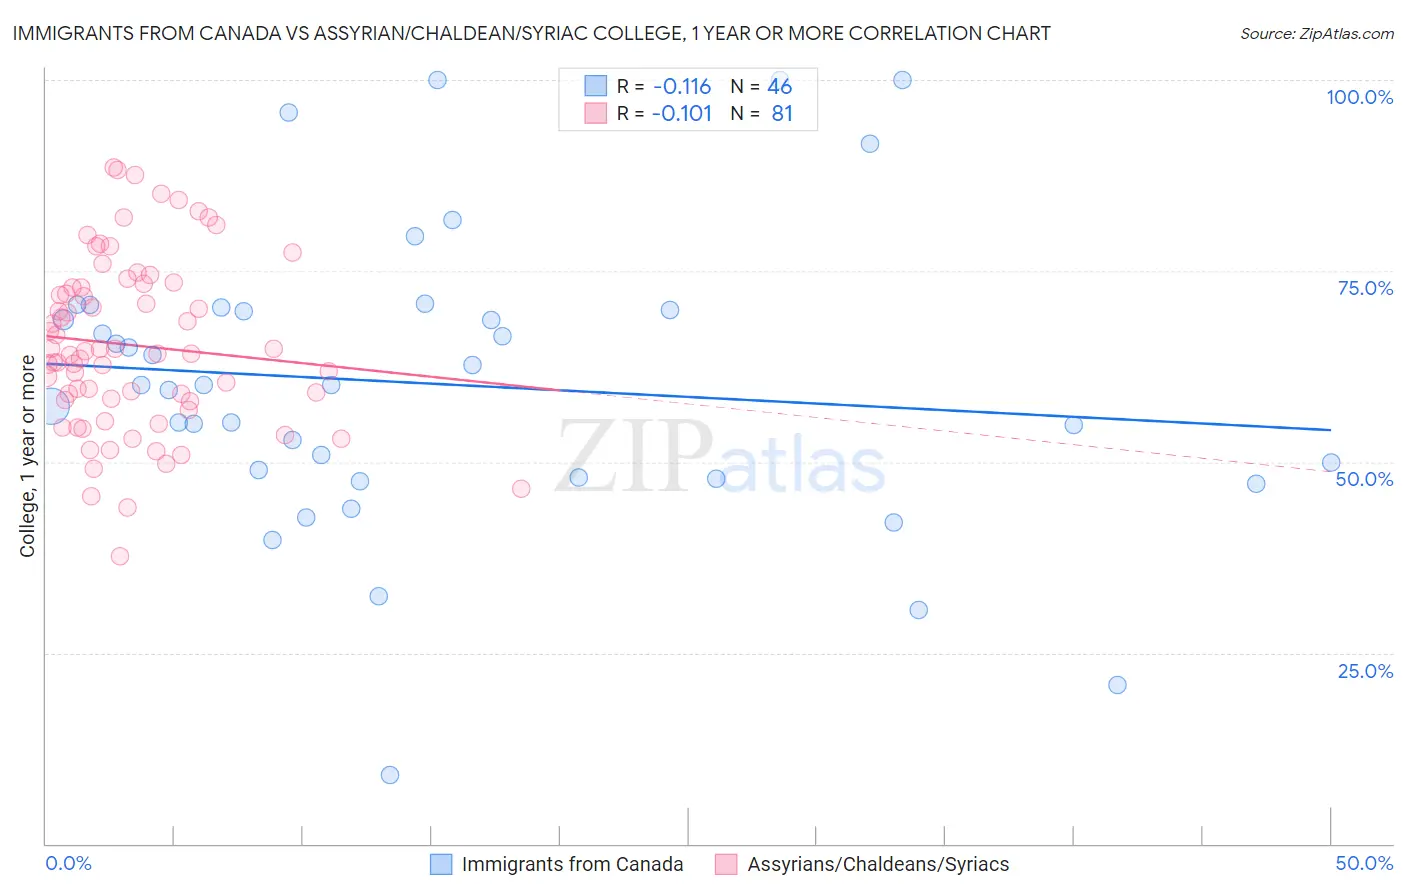
Immigrants from Canada vs Assyrian/Chaldean/Syriac College, 1 year or more Correlation Chart
The statistical analysis conducted on geographies consisting of 459,391,400 people shows a poor negative correlation between the proportion of Immigrants from Canada and percentage of population with at least college, 1 year or more education in the United States with a correlation coefficient (R) of -0.116 and weighted average of 63.1%. Similarly, the statistical analysis conducted on geographies consisting of 110,318,304 people shows a poor negative correlation between the proportion of Assyrians/Chaldeans/Syriacs and percentage of population with at least college, 1 year or more education in the United States with a correlation coefficient (R) of -0.101 and weighted average of 61.5%, a difference of 2.6%.
College, 1 year or more Correlation Summary
| Measurement | Immigrants from Canada | Assyrian/Chaldean/Syriac |
| Minimum | 9.0% | 37.7% |
| Maximum | 100.0% | 88.6% |
| Range | 91.0% | 50.9% |
| Mean | 60.2% | 65.3% |
| Median | 60.0% | 64.2% |
| Interquartile 25% (IQ1) | 47.9% | 58.1% |
| Interquartile 75% (IQ3) | 69.9% | 73.1% |
| Interquartile Range (IQR) | 22.0% | 15.1% |
| Standard Deviation (Sample) | 19.5% | 11.2% |
| Standard Deviation (Population) | 19.2% | 11.1% |
Similar Demographics by College, 1 year or more
Demographics Similar to Immigrants from Canada by College, 1 year or more
In terms of college, 1 year or more, the demographic groups most similar to Immigrants from Canada are Egyptian (63.1%, a difference of 0.060%), Immigrants from Moldova (63.0%, a difference of 0.070%), Immigrants from North America (63.0%, a difference of 0.080%), Armenian (63.0%, a difference of 0.17%), and Argentinean (63.2%, a difference of 0.18%).
| Demographics | Rating | Rank | College, 1 year or more |
| Immigrants | Spain | 99.4 /100 | #64 | Exceptional 63.4% |
| Maltese | 99.3 /100 | #65 | Exceptional 63.4% |
| Immigrants | Europe | 99.3 /100 | #66 | Exceptional 63.3% |
| Immigrants | Romania | 99.3 /100 | #67 | Exceptional 63.3% |
| Immigrants | Greece | 99.3 /100 | #68 | Exceptional 63.3% |
| Immigrants | Zimbabwe | 99.3 /100 | #69 | Exceptional 63.3% |
| Argentineans | 99.2 /100 | #70 | Exceptional 63.2% |
| Immigrants | Canada | 99.1 /100 | #71 | Exceptional 63.1% |
| Egyptians | 99.0 /100 | #72 | Exceptional 63.1% |
| Immigrants | Moldova | 99.0 /100 | #73 | Exceptional 63.0% |
| Immigrants | North America | 99.0 /100 | #74 | Exceptional 63.0% |
| Armenians | 98.9 /100 | #75 | Exceptional 63.0% |
| Paraguayans | 98.8 /100 | #76 | Exceptional 62.9% |
| Ethiopians | 98.8 /100 | #77 | Exceptional 62.9% |
| Immigrants | Lebanon | 98.8 /100 | #78 | Exceptional 62.9% |
Demographics Similar to Assyrians/Chaldeans/Syriacs by College, 1 year or more
In terms of college, 1 year or more, the demographic groups most similar to Assyrians/Chaldeans/Syriacs are Pakistani (61.5%, a difference of 0.0%), Immigrants from Jordan (61.4%, a difference of 0.11%), Immigrants from Brazil (61.6%, a difference of 0.13%), Arab (61.6%, a difference of 0.14%), and Lebanese (61.6%, a difference of 0.18%).
| Demographics | Rating | Rank | College, 1 year or more |
| Austrians | 95.4 /100 | #112 | Exceptional 61.8% |
| Ukrainians | 95.2 /100 | #113 | Exceptional 61.8% |
| Danes | 94.8 /100 | #114 | Exceptional 61.7% |
| Norwegians | 94.5 /100 | #115 | Exceptional 61.7% |
| Lebanese | 94.1 /100 | #116 | Exceptional 61.6% |
| Arabs | 93.9 /100 | #117 | Exceptional 61.6% |
| Immigrants | Brazil | 93.9 /100 | #118 | Exceptional 61.6% |
| Assyrians/Chaldeans/Syriacs | 93.3 /100 | #119 | Exceptional 61.5% |
| Pakistanis | 93.2 /100 | #120 | Exceptional 61.5% |
| Immigrants | Jordan | 92.7 /100 | #121 | Exceptional 61.4% |
| Immigrants | Chile | 92.3 /100 | #122 | Exceptional 61.4% |
| Serbians | 92.2 /100 | #123 | Exceptional 61.4% |
| Venezuelans | 92.1 /100 | #124 | Exceptional 61.3% |
| Immigrants | Syria | 91.6 /100 | #125 | Exceptional 61.3% |
| Alsatians | 91.3 /100 | #126 | Exceptional 61.3% |