Immigrants from Canada vs Bangladeshi 12th Grade, No Diploma
COMPARE
Immigrants from Canada
Bangladeshi
12th Grade, No Diploma
12th Grade, No Diploma Comparison
Immigrants from Canada
Bangladeshis
92.8%
12TH GRADE, NO DIPLOMA
99.7/ 100
METRIC RATING
57th/ 347
METRIC RANK
89.3%
12TH GRADE, NO DIPLOMA
0.1/ 100
METRIC RATING
270th/ 347
METRIC RANK
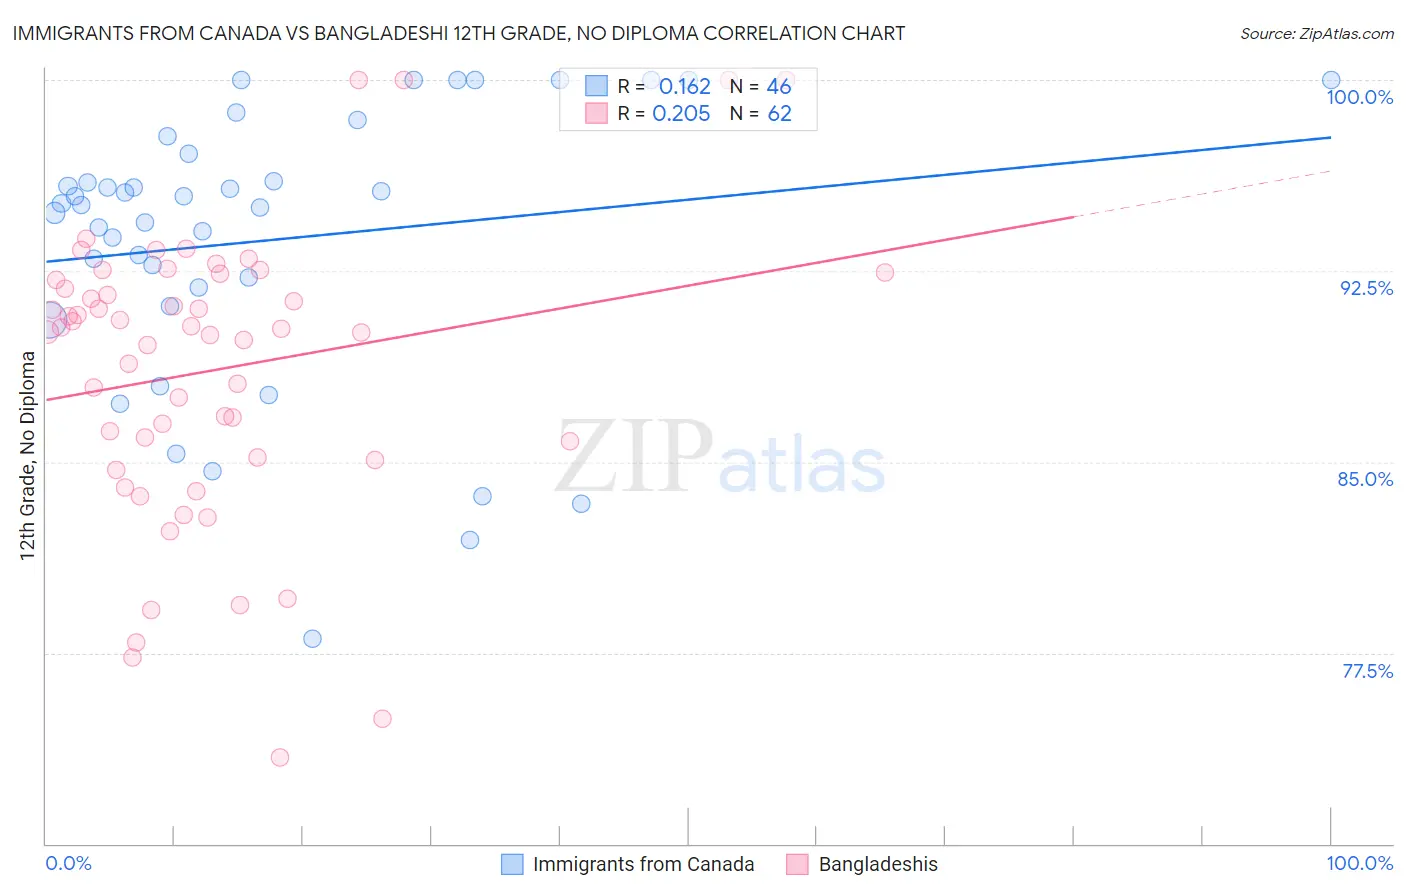
Immigrants from Canada vs Bangladeshi 12th Grade, No Diploma Correlation Chart
The statistical analysis conducted on geographies consisting of 459,397,067 people shows a poor positive correlation between the proportion of Immigrants from Canada and percentage of population with at least 12th grade (no diploma) education in the United States with a correlation coefficient (R) of 0.162 and weighted average of 92.8%. Similarly, the statistical analysis conducted on geographies consisting of 141,450,108 people shows a weak positive correlation between the proportion of Bangladeshis and percentage of population with at least 12th grade (no diploma) education in the United States with a correlation coefficient (R) of 0.205 and weighted average of 89.3%, a difference of 4.0%.
12th Grade, No Diploma Correlation Summary
| Measurement | Immigrants from Canada | Bangladeshi |
| Minimum | 78.1% | 73.4% |
| Maximum | 100.0% | 100.0% |
| Range | 21.9% | 26.6% |
| Mean | 93.7% | 88.6% |
| Median | 95.1% | 90.2% |
| Interquartile 25% (IQ1) | 91.9% | 85.2% |
| Interquartile 75% (IQ3) | 97.1% | 92.1% |
| Interquartile Range (IQR) | 5.2% | 7.0% |
| Standard Deviation (Sample) | 5.4% | 5.7% |
| Standard Deviation (Population) | 5.4% | 5.7% |
Similar Demographics by 12th Grade, No Diploma
Demographics Similar to Immigrants from Canada by 12th Grade, No Diploma
In terms of 12th grade, no diploma, the demographic groups most similar to Immigrants from Canada are Immigrants from Taiwan (92.8%, a difference of 0.020%), Welsh (92.8%, a difference of 0.030%), New Zealander (92.8%, a difference of 0.030%), Immigrants from North America (92.8%, a difference of 0.030%), and Slavic (92.8%, a difference of 0.030%).
| Demographics | Rating | Rank | 12th Grade, No Diploma |
| Tsimshian | 99.8 /100 | #50 | Exceptional 92.9% |
| Immigrants | Belgium | 99.8 /100 | #51 | Exceptional 92.9% |
| Immigrants | Sweden | 99.8 /100 | #52 | Exceptional 92.8% |
| Serbians | 99.7 /100 | #53 | Exceptional 92.8% |
| Hungarians | 99.7 /100 | #54 | Exceptional 92.8% |
| Welsh | 99.7 /100 | #55 | Exceptional 92.8% |
| New Zealanders | 99.7 /100 | #56 | Exceptional 92.8% |
| Immigrants | Canada | 99.7 /100 | #57 | Exceptional 92.8% |
| Immigrants | Taiwan | 99.7 /100 | #58 | Exceptional 92.8% |
| Immigrants | North America | 99.7 /100 | #59 | Exceptional 92.8% |
| Slavs | 99.7 /100 | #60 | Exceptional 92.8% |
| Immigrants | Japan | 99.7 /100 | #61 | Exceptional 92.8% |
| Ukrainians | 99.6 /100 | #62 | Exceptional 92.7% |
| Zimbabweans | 99.6 /100 | #63 | Exceptional 92.7% |
| Immigrants | Netherlands | 99.6 /100 | #64 | Exceptional 92.7% |
Demographics Similar to Bangladeshis by 12th Grade, No Diploma
In terms of 12th grade, no diploma, the demographic groups most similar to Bangladeshis are Black/African American (89.3%, a difference of 0.0%), Malaysian (89.2%, a difference of 0.020%), U.S. Virgin Islander (89.3%, a difference of 0.050%), Immigrants from Trinidad and Tobago (89.3%, a difference of 0.080%), and West Indian (89.3%, a difference of 0.10%).
| Demographics | Rating | Rank | 12th Grade, No Diploma |
| Immigrants | Jamaica | 0.2 /100 | #263 | Tragic 89.5% |
| Sri Lankans | 0.2 /100 | #264 | Tragic 89.4% |
| Trinidadians and Tobagonians | 0.2 /100 | #265 | Tragic 89.4% |
| Seminole | 0.2 /100 | #266 | Tragic 89.4% |
| West Indians | 0.2 /100 | #267 | Tragic 89.3% |
| Immigrants | Trinidad and Tobago | 0.1 /100 | #268 | Tragic 89.3% |
| U.S. Virgin Islanders | 0.1 /100 | #269 | Tragic 89.3% |
| Bangladeshis | 0.1 /100 | #270 | Tragic 89.3% |
| Blacks/African Americans | 0.1 /100 | #271 | Tragic 89.3% |
| Malaysians | 0.1 /100 | #272 | Tragic 89.2% |
| Barbadians | 0.1 /100 | #273 | Tragic 89.1% |
| Cajuns | 0.1 /100 | #274 | Tragic 89.1% |
| Immigrants | Congo | 0.1 /100 | #275 | Tragic 89.0% |
| Ute | 0.1 /100 | #276 | Tragic 89.0% |
| Immigrants | Barbados | 0.0 /100 | #277 | Tragic 89.0% |