Hmong vs Bangladeshi 12th Grade, No Diploma
COMPARE
Hmong
Bangladeshi
12th Grade, No Diploma
12th Grade, No Diploma Comparison
Hmong
Bangladeshis
91.3%
12TH GRADE, NO DIPLOMA
58.0/ 100
METRIC RATING
166th/ 347
METRIC RANK
89.3%
12TH GRADE, NO DIPLOMA
0.1/ 100
METRIC RATING
270th/ 347
METRIC RANK
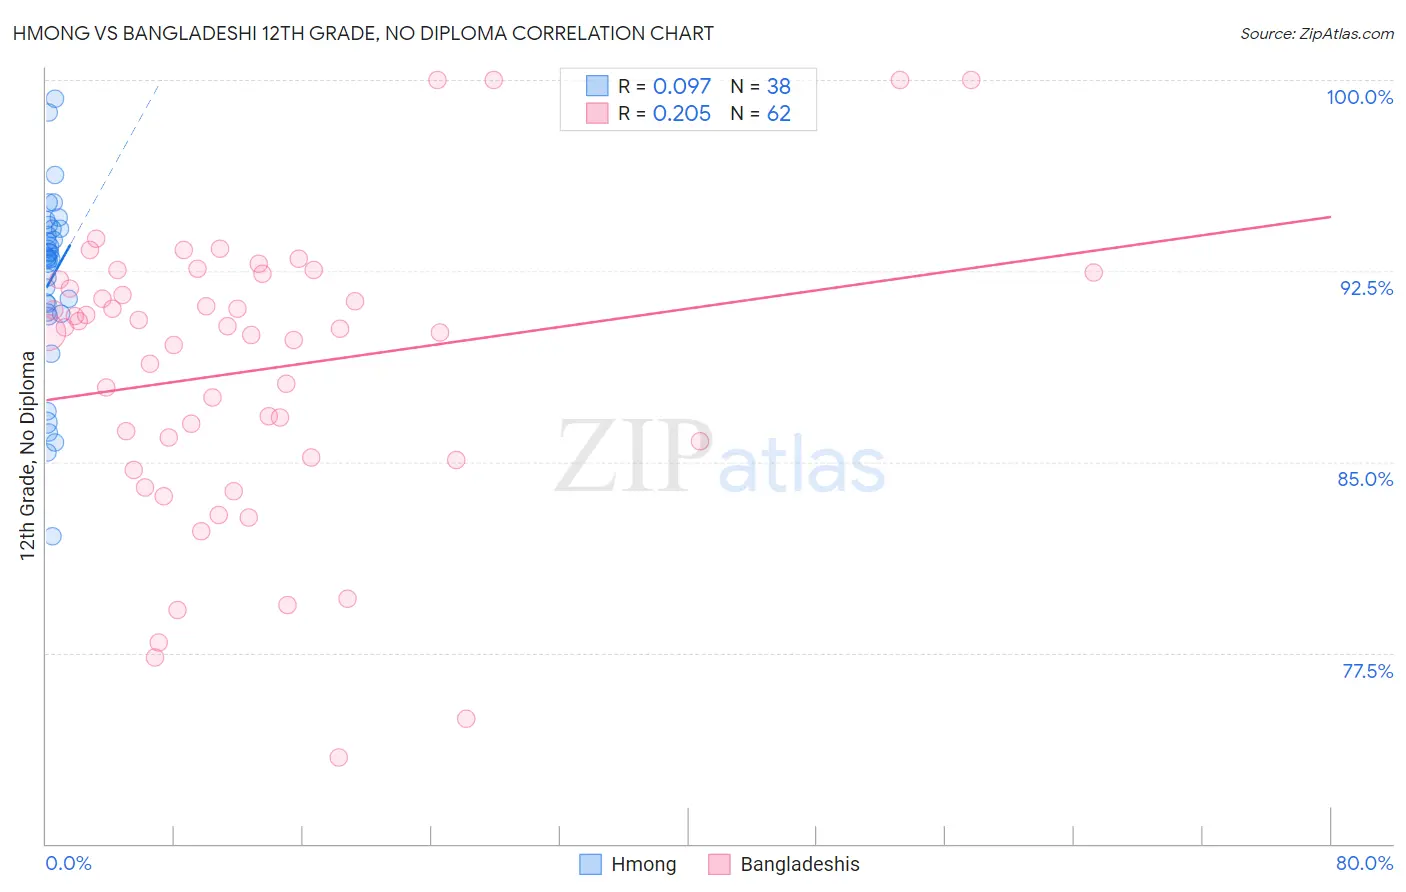
Hmong vs Bangladeshi 12th Grade, No Diploma Correlation Chart
The statistical analysis conducted on geographies consisting of 24,672,093 people shows a slight positive correlation between the proportion of Hmong and percentage of population with at least 12th grade (no diploma) education in the United States with a correlation coefficient (R) of 0.097 and weighted average of 91.3%. Similarly, the statistical analysis conducted on geographies consisting of 141,450,108 people shows a weak positive correlation between the proportion of Bangladeshis and percentage of population with at least 12th grade (no diploma) education in the United States with a correlation coefficient (R) of 0.205 and weighted average of 89.3%, a difference of 2.2%.
12th Grade, No Diploma Correlation Summary
| Measurement | Hmong | Bangladeshi |
| Minimum | 82.1% | 73.4% |
| Maximum | 99.2% | 100.0% |
| Range | 17.1% | 26.6% |
| Mean | 92.1% | 88.6% |
| Median | 93.0% | 90.2% |
| Interquartile 25% (IQ1) | 90.9% | 85.2% |
| Interquartile 75% (IQ3) | 94.2% | 92.1% |
| Interquartile Range (IQR) | 3.3% | 7.0% |
| Standard Deviation (Sample) | 3.6% | 5.7% |
| Standard Deviation (Population) | 3.5% | 5.7% |
Similar Demographics by 12th Grade, No Diploma
Demographics Similar to Hmong by 12th Grade, No Diploma
In terms of 12th grade, no diploma, the demographic groups most similar to Hmong are Alsatian (91.3%, a difference of 0.0%), Immigrants from Malaysia (91.3%, a difference of 0.0%), Cree (91.2%, a difference of 0.010%), Immigrants from Asia (91.3%, a difference of 0.040%), and Immigrants from China (91.3%, a difference of 0.040%).
| Demographics | Rating | Rank | 12th Grade, No Diploma |
| Laotians | 64.4 /100 | #159 | Good 91.3% |
| Immigrants | Albania | 64.1 /100 | #160 | Good 91.3% |
| Immigrants | Hong Kong | 63.8 /100 | #161 | Good 91.3% |
| Brazilians | 62.0 /100 | #162 | Good 91.3% |
| Immigrants | Asia | 61.5 /100 | #163 | Good 91.3% |
| Immigrants | China | 60.9 /100 | #164 | Good 91.3% |
| Alsatians | 58.3 /100 | #165 | Average 91.3% |
| Hmong | 58.0 /100 | #166 | Average 91.3% |
| Immigrants | Malaysia | 57.8 /100 | #167 | Average 91.3% |
| Cree | 57.0 /100 | #168 | Average 91.2% |
| Immigrants | Indonesia | 54.9 /100 | #169 | Average 91.2% |
| Delaware | 52.8 /100 | #170 | Average 91.2% |
| Immigrants | Morocco | 51.4 /100 | #171 | Average 91.2% |
| Bermudans | 50.8 /100 | #172 | Average 91.2% |
| Bolivians | 50.4 /100 | #173 | Average 91.2% |
Demographics Similar to Bangladeshis by 12th Grade, No Diploma
In terms of 12th grade, no diploma, the demographic groups most similar to Bangladeshis are Black/African American (89.3%, a difference of 0.0%), Malaysian (89.2%, a difference of 0.020%), U.S. Virgin Islander (89.3%, a difference of 0.050%), Immigrants from Trinidad and Tobago (89.3%, a difference of 0.080%), and West Indian (89.3%, a difference of 0.10%).
| Demographics | Rating | Rank | 12th Grade, No Diploma |
| Immigrants | Jamaica | 0.2 /100 | #263 | Tragic 89.5% |
| Sri Lankans | 0.2 /100 | #264 | Tragic 89.4% |
| Trinidadians and Tobagonians | 0.2 /100 | #265 | Tragic 89.4% |
| Seminole | 0.2 /100 | #266 | Tragic 89.4% |
| West Indians | 0.2 /100 | #267 | Tragic 89.3% |
| Immigrants | Trinidad and Tobago | 0.1 /100 | #268 | Tragic 89.3% |
| U.S. Virgin Islanders | 0.1 /100 | #269 | Tragic 89.3% |
| Bangladeshis | 0.1 /100 | #270 | Tragic 89.3% |
| Blacks/African Americans | 0.1 /100 | #271 | Tragic 89.3% |
| Malaysians | 0.1 /100 | #272 | Tragic 89.2% |
| Barbadians | 0.1 /100 | #273 | Tragic 89.1% |
| Cajuns | 0.1 /100 | #274 | Tragic 89.1% |
| Immigrants | Congo | 0.1 /100 | #275 | Tragic 89.0% |
| Ute | 0.1 /100 | #276 | Tragic 89.0% |
| Immigrants | Barbados | 0.0 /100 | #277 | Tragic 89.0% |