Dutch West Indian vs Bangladeshi 12th Grade, No Diploma
COMPARE
Dutch West Indian
Bangladeshi
12th Grade, No Diploma
12th Grade, No Diploma Comparison
Dutch West Indians
Bangladeshis
88.5%
12TH GRADE, NO DIPLOMA
0.0/ 100
METRIC RATING
289th/ 347
METRIC RANK
89.3%
12TH GRADE, NO DIPLOMA
0.1/ 100
METRIC RATING
270th/ 347
METRIC RANK
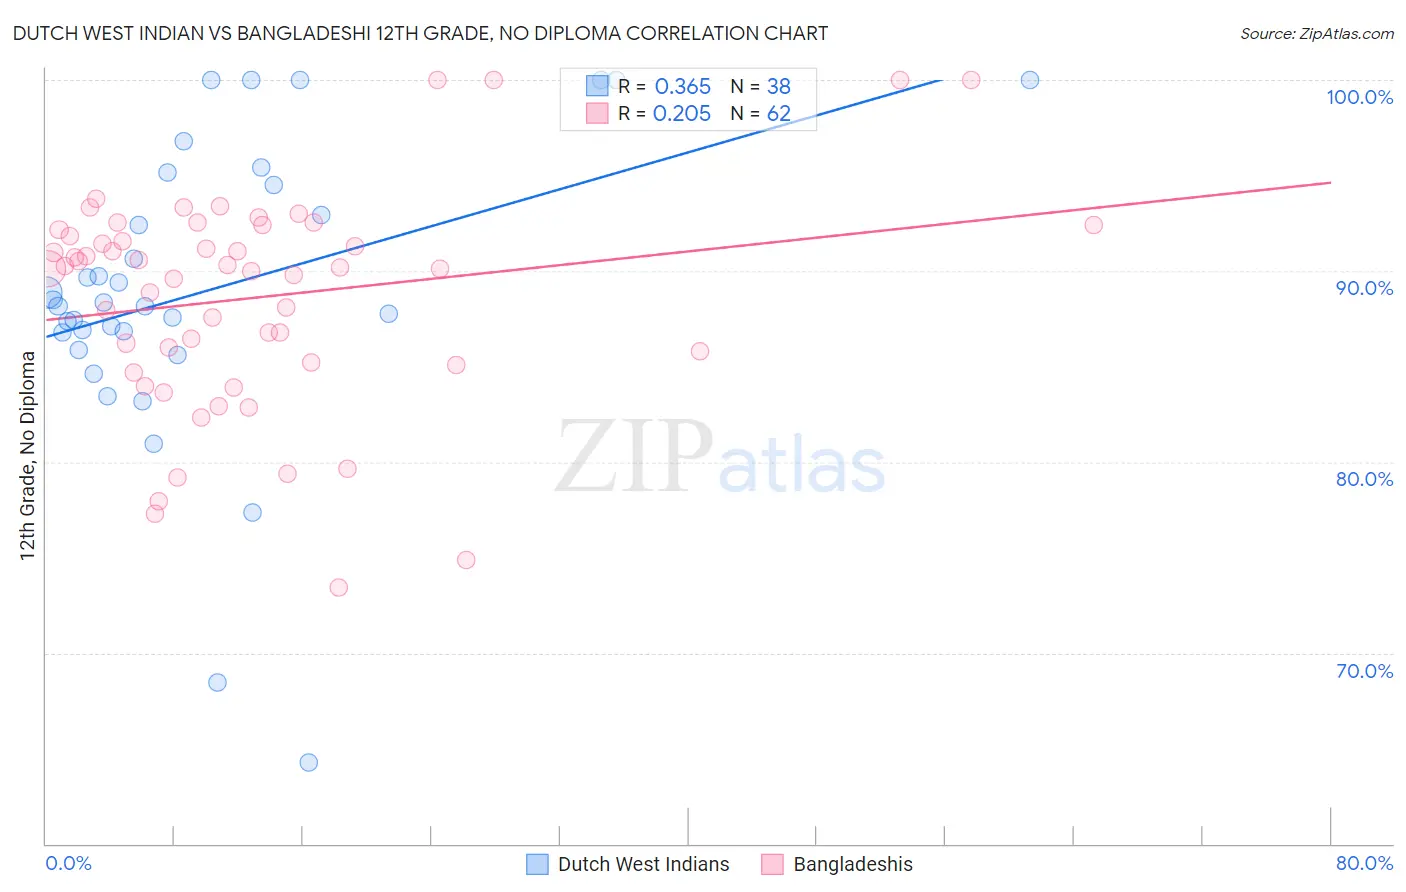
Dutch West Indian vs Bangladeshi 12th Grade, No Diploma Correlation Chart
The statistical analysis conducted on geographies consisting of 85,776,098 people shows a mild positive correlation between the proportion of Dutch West Indians and percentage of population with at least 12th grade (no diploma) education in the United States with a correlation coefficient (R) of 0.365 and weighted average of 88.5%. Similarly, the statistical analysis conducted on geographies consisting of 141,450,108 people shows a weak positive correlation between the proportion of Bangladeshis and percentage of population with at least 12th grade (no diploma) education in the United States with a correlation coefficient (R) of 0.205 and weighted average of 89.3%, a difference of 0.80%.
12th Grade, No Diploma Correlation Summary
| Measurement | Dutch West Indian | Bangladeshi |
| Minimum | 64.3% | 73.4% |
| Maximum | 100.0% | 100.0% |
| Range | 35.7% | 26.6% |
| Mean | 88.9% | 88.6% |
| Median | 88.2% | 90.2% |
| Interquartile 25% (IQ1) | 86.8% | 85.2% |
| Interquartile 75% (IQ3) | 94.5% | 92.1% |
| Interquartile Range (IQR) | 7.7% | 7.0% |
| Standard Deviation (Sample) | 7.9% | 5.7% |
| Standard Deviation (Population) | 7.8% | 5.7% |
Demographics Similar to Dutch West Indians and Bangladeshis by 12th Grade, No Diploma
In terms of 12th grade, no diploma, the demographic groups most similar to Dutch West Indians are Immigrants from Fiji (88.6%, a difference of 0.10%), Immigrants from West Indies (88.6%, a difference of 0.11%), Hopi (88.6%, a difference of 0.11%), Indonesian (88.6%, a difference of 0.12%), and Pennsylvania German (88.7%, a difference of 0.13%). Similarly, the demographic groups most similar to Bangladeshis are Black/African American (89.3%, a difference of 0.0%), Malaysian (89.2%, a difference of 0.020%), U.S. Virgin Islander (89.3%, a difference of 0.050%), Barbadian (89.1%, a difference of 0.14%), and Cajun (89.1%, a difference of 0.16%).
| Demographics | Rating | Rank | 12th Grade, No Diploma |
| U.S. Virgin Islanders | 0.1 /100 | #269 | Tragic 89.3% |
| Bangladeshis | 0.1 /100 | #270 | Tragic 89.3% |
| Blacks/African Americans | 0.1 /100 | #271 | Tragic 89.3% |
| Malaysians | 0.1 /100 | #272 | Tragic 89.2% |
| Barbadians | 0.1 /100 | #273 | Tragic 89.1% |
| Cajuns | 0.1 /100 | #274 | Tragic 89.1% |
| Immigrants | Congo | 0.1 /100 | #275 | Tragic 89.0% |
| Ute | 0.1 /100 | #276 | Tragic 89.0% |
| Immigrants | Barbados | 0.0 /100 | #277 | Tragic 89.0% |
| Immigrants | St. Vincent and the Grenadines | 0.0 /100 | #278 | Tragic 88.9% |
| Immigrants | Laos | 0.0 /100 | #279 | Tragic 88.9% |
| Immigrants | Burma/Myanmar | 0.0 /100 | #280 | Tragic 88.9% |
| Cubans | 0.0 /100 | #281 | Tragic 88.9% |
| Immigrants | Vietnam | 0.0 /100 | #282 | Tragic 88.7% |
| Paiute | 0.0 /100 | #283 | Tragic 88.7% |
| Pennsylvania Germans | 0.0 /100 | #284 | Tragic 88.7% |
| Indonesians | 0.0 /100 | #285 | Tragic 88.6% |
| Immigrants | West Indies | 0.0 /100 | #286 | Tragic 88.6% |
| Hopi | 0.0 /100 | #287 | Tragic 88.6% |
| Immigrants | Fiji | 0.0 /100 | #288 | Tragic 88.6% |
| Dutch West Indians | 0.0 /100 | #289 | Tragic 88.5% |