Immigrants from Canada vs Bangladeshi Professional Degree
COMPARE
Immigrants from Canada
Bangladeshi
Professional Degree
Professional Degree Comparison
Immigrants from Canada
Bangladeshis
5.3%
PROFESSIONAL DEGREE
99.7/ 100
METRIC RATING
76th/ 347
METRIC RANK
3.1%
PROFESSIONAL DEGREE
0.0/ 100
METRIC RATING
329th/ 347
METRIC RANK
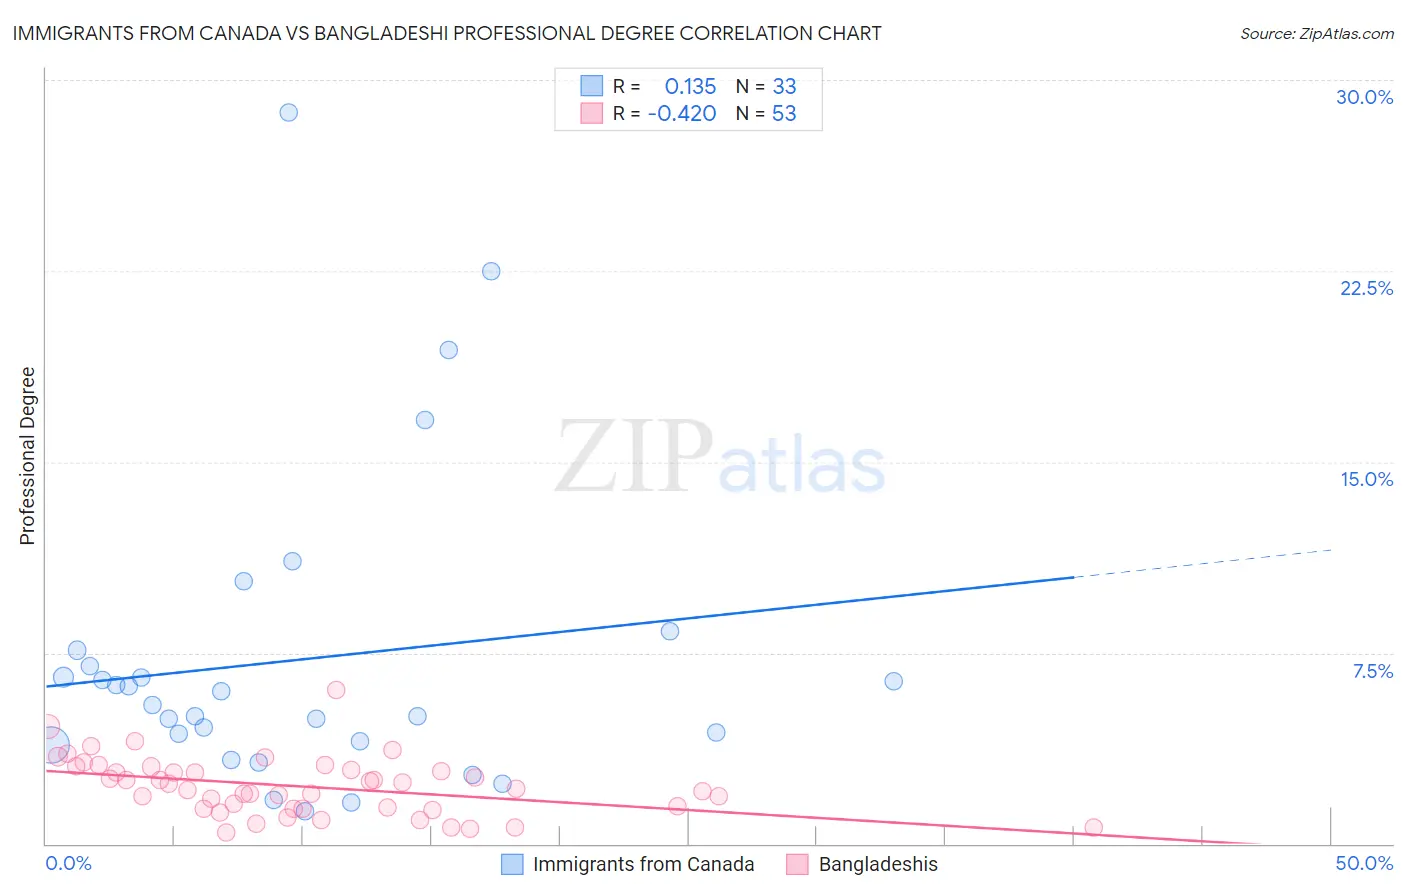
Immigrants from Canada vs Bangladeshi Professional Degree Correlation Chart
The statistical analysis conducted on geographies consisting of 457,915,451 people shows a poor positive correlation between the proportion of Immigrants from Canada and percentage of population with at least professional degree education in the United States with a correlation coefficient (R) of 0.135 and weighted average of 5.3%. Similarly, the statistical analysis conducted on geographies consisting of 141,225,031 people shows a moderate negative correlation between the proportion of Bangladeshis and percentage of population with at least professional degree education in the United States with a correlation coefficient (R) of -0.420 and weighted average of 3.1%, a difference of 73.0%.
Professional Degree Correlation Summary
| Measurement | Immigrants from Canada | Bangladeshi |
| Minimum | 1.3% | 0.42% |
| Maximum | 28.7% | 6.0% |
| Range | 27.4% | 5.6% |
| Mean | 7.2% | 2.3% |
| Median | 5.5% | 2.2% |
| Interquartile 25% (IQ1) | 4.0% | 1.4% |
| Interquartile 75% (IQ3) | 7.3% | 3.0% |
| Interquartile Range (IQR) | 3.3% | 1.6% |
| Standard Deviation (Sample) | 6.1% | 1.1% |
| Standard Deviation (Population) | 6.0% | 1.1% |
Similar Demographics by Professional Degree
Demographics Similar to Immigrants from Canada by Professional Degree
In terms of professional degree, the demographic groups most similar to Immigrants from Canada are Immigrants from Ethiopia (5.3%, a difference of 0.040%), Immigrants from Indonesia (5.3%, a difference of 0.090%), Armenian (5.3%, a difference of 0.090%), Ethiopian (5.4%, a difference of 0.22%), and Immigrants from North America (5.3%, a difference of 0.26%).
| Demographics | Rating | Rank | Professional Degree |
| Immigrants | Hungary | 99.9 /100 | #69 | Exceptional 5.5% |
| Bhutanese | 99.8 /100 | #70 | Exceptional 5.4% |
| Immigrants | Western Asia | 99.8 /100 | #71 | Exceptional 5.4% |
| Lithuanians | 99.8 /100 | #72 | Exceptional 5.4% |
| Immigrants | Romania | 99.8 /100 | #73 | Exceptional 5.4% |
| Ethiopians | 99.7 /100 | #74 | Exceptional 5.4% |
| Immigrants | Indonesia | 99.7 /100 | #75 | Exceptional 5.3% |
| Immigrants | Canada | 99.7 /100 | #76 | Exceptional 5.3% |
| Immigrants | Ethiopia | 99.7 /100 | #77 | Exceptional 5.3% |
| Armenians | 99.7 /100 | #78 | Exceptional 5.3% |
| Immigrants | North America | 99.7 /100 | #79 | Exceptional 5.3% |
| Immigrants | England | 99.6 /100 | #80 | Exceptional 5.3% |
| Immigrants | Brazil | 99.6 /100 | #81 | Exceptional 5.3% |
| Romanians | 99.6 /100 | #82 | Exceptional 5.3% |
| Carpatho Rusyns | 99.6 /100 | #83 | Exceptional 5.3% |
Demographics Similar to Bangladeshis by Professional Degree
In terms of professional degree, the demographic groups most similar to Bangladeshis are Immigrants from Cabo Verde (3.1%, a difference of 0.080%), Kiowa (3.1%, a difference of 0.20%), Creek (3.1%, a difference of 0.21%), Dutch West Indian (3.1%, a difference of 0.27%), and Yakama (3.1%, a difference of 0.31%).
| Demographics | Rating | Rank | Professional Degree |
| Hispanics or Latinos | 0.0 /100 | #322 | Tragic 3.2% |
| Inupiat | 0.0 /100 | #323 | Tragic 3.2% |
| Crow | 0.0 /100 | #324 | Tragic 3.2% |
| Yaqui | 0.0 /100 | #325 | Tragic 3.2% |
| Menominee | 0.0 /100 | #326 | Tragic 3.1% |
| Dutch West Indians | 0.0 /100 | #327 | Tragic 3.1% |
| Creek | 0.0 /100 | #328 | Tragic 3.1% |
| Bangladeshis | 0.0 /100 | #329 | Tragic 3.1% |
| Immigrants | Cabo Verde | 0.0 /100 | #330 | Tragic 3.1% |
| Kiowa | 0.0 /100 | #331 | Tragic 3.1% |
| Yakama | 0.0 /100 | #332 | Tragic 3.1% |
| Puget Sound Salish | 0.0 /100 | #333 | Tragic 3.1% |
| Pennsylvania Germans | 0.0 /100 | #334 | Tragic 3.0% |
| Natives/Alaskans | 0.0 /100 | #335 | Tragic 3.0% |
| Fijians | 0.0 /100 | #336 | Tragic 2.9% |