Immigrants from Cameroon vs Immigrants from Bolivia 11th Grade
COMPARE
Immigrants from Cameroon
Immigrants from Bolivia
11th Grade
11th Grade Comparison
Immigrants from Cameroon
Immigrants from Bolivia
91.8%
11TH GRADE
4.4/ 100
METRIC RATING
227th/ 347
METRIC RANK
91.7%
11TH GRADE
2.8/ 100
METRIC RATING
237th/ 347
METRIC RANK
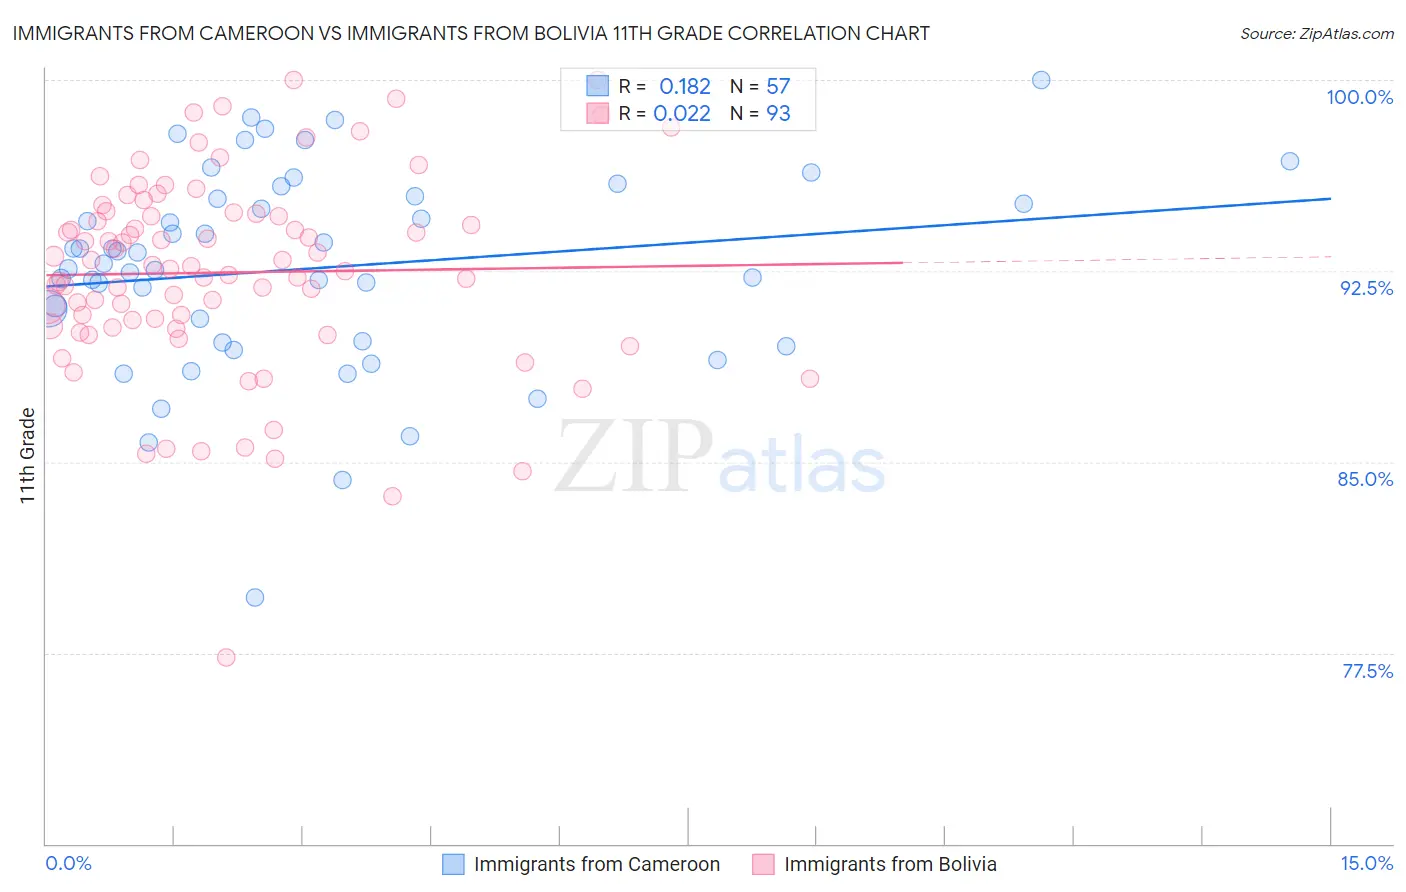
Immigrants from Cameroon vs Immigrants from Bolivia 11th Grade Correlation Chart
The statistical analysis conducted on geographies consisting of 130,618,704 people shows a poor positive correlation between the proportion of Immigrants from Cameroon and percentage of population with at least 11th grade education in the United States with a correlation coefficient (R) of 0.182 and weighted average of 91.8%. Similarly, the statistical analysis conducted on geographies consisting of 158,727,043 people shows no correlation between the proportion of Immigrants from Bolivia and percentage of population with at least 11th grade education in the United States with a correlation coefficient (R) of 0.022 and weighted average of 91.7%, a difference of 0.11%.
11th Grade Correlation Summary
| Measurement | Immigrants from Cameroon | Immigrants from Bolivia |
| Minimum | 79.7% | 77.3% |
| Maximum | 100.0% | 100.0% |
| Range | 20.3% | 22.7% |
| Mean | 92.6% | 92.4% |
| Median | 92.8% | 92.7% |
| Interquartile 25% (IQ1) | 89.7% | 90.3% |
| Interquartile 75% (IQ3) | 95.4% | 94.8% |
| Interquartile Range (IQR) | 5.7% | 4.5% |
| Standard Deviation (Sample) | 3.9% | 4.0% |
| Standard Deviation (Population) | 3.9% | 3.9% |
Demographics Similar to Immigrants from Cameroon and Immigrants from Bolivia by 11th Grade
In terms of 11th grade, the demographic groups most similar to Immigrants from Cameroon are Immigrants from Panama (91.8%, a difference of 0.0%), Nigerian (91.8%, a difference of 0.010%), Immigrants from Afghanistan (91.8%, a difference of 0.030%), Choctaw (91.8%, a difference of 0.040%), and Immigrants from Somalia (91.9%, a difference of 0.050%). Similarly, the demographic groups most similar to Immigrants from Bolivia are Subsaharan African (91.7%, a difference of 0.0%), Colombian (91.7%, a difference of 0.0%), Armenian (91.7%, a difference of 0.010%), Comanche (91.7%, a difference of 0.020%), and Hopi (91.7%, a difference of 0.030%).
| Demographics | Rating | Rank | 11th Grade |
| Immigrants | Africa | 6.5 /100 | #222 | Tragic 91.9% |
| Immigrants | Bahamas | 6.5 /100 | #223 | Tragic 91.9% |
| Costa Ricans | 6.3 /100 | #224 | Tragic 91.9% |
| Immigrants | Zaire | 5.4 /100 | #225 | Tragic 91.9% |
| Immigrants | Somalia | 5.2 /100 | #226 | Tragic 91.9% |
| Immigrants | Cameroon | 4.4 /100 | #227 | Tragic 91.8% |
| Immigrants | Panama | 4.3 /100 | #228 | Tragic 91.8% |
| Nigerians | 4.3 /100 | #229 | Tragic 91.8% |
| Immigrants | Afghanistan | 3.9 /100 | #230 | Tragic 91.8% |
| Choctaw | 3.7 /100 | #231 | Tragic 91.8% |
| Uruguayans | 3.5 /100 | #232 | Tragic 91.8% |
| Cheyenne | 3.3 /100 | #233 | Tragic 91.8% |
| Armenians | 2.9 /100 | #234 | Tragic 91.7% |
| Sub-Saharan Africans | 2.9 /100 | #235 | Tragic 91.7% |
| Colombians | 2.8 /100 | #236 | Tragic 91.7% |
| Immigrants | Bolivia | 2.8 /100 | #237 | Tragic 91.7% |
| Comanche | 2.6 /100 | #238 | Tragic 91.7% |
| Hopi | 2.5 /100 | #239 | Tragic 91.7% |
| South Americans | 2.0 /100 | #240 | Tragic 91.6% |
| Bahamians | 1.8 /100 | #241 | Tragic 91.6% |
| Immigrants | Middle Africa | 1.6 /100 | #242 | Tragic 91.6% |