Immigrants from Cameroon vs Australian 11th Grade
COMPARE
Immigrants from Cameroon
Australian
11th Grade
11th Grade Comparison
Immigrants from Cameroon
Australians
91.8%
11TH GRADE
4.4/ 100
METRIC RATING
227th/ 347
METRIC RANK
94.1%
11TH GRADE
99.9/ 100
METRIC RATING
45th/ 347
METRIC RANK
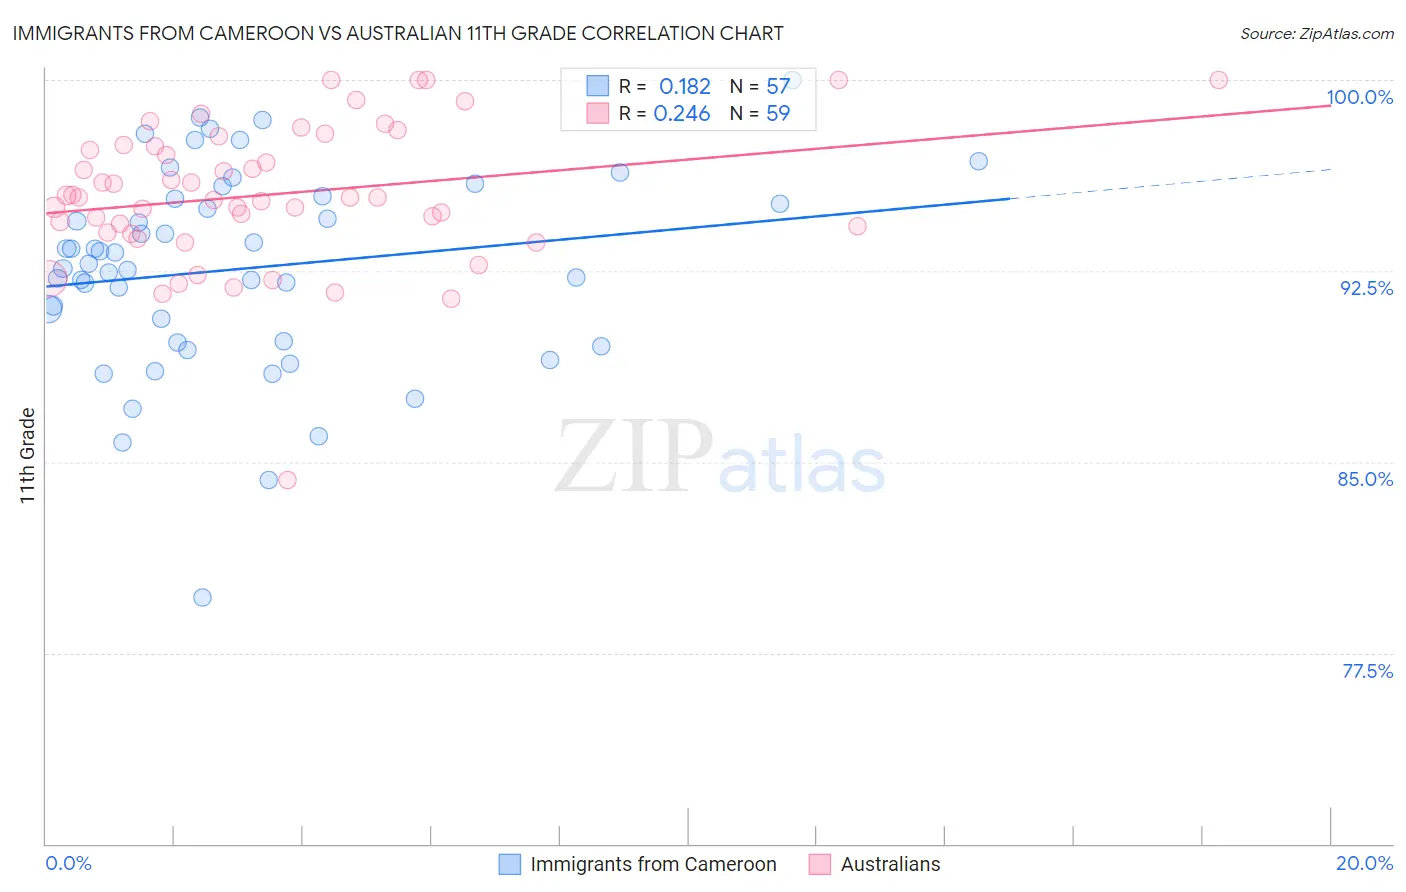
Immigrants from Cameroon vs Australian 11th Grade Correlation Chart
The statistical analysis conducted on geographies consisting of 130,618,704 people shows a poor positive correlation between the proportion of Immigrants from Cameroon and percentage of population with at least 11th grade education in the United States with a correlation coefficient (R) of 0.182 and weighted average of 91.8%. Similarly, the statistical analysis conducted on geographies consisting of 224,153,693 people shows a weak positive correlation between the proportion of Australians and percentage of population with at least 11th grade education in the United States with a correlation coefficient (R) of 0.246 and weighted average of 94.1%, a difference of 2.5%.
11th Grade Correlation Summary
| Measurement | Immigrants from Cameroon | Australian |
| Minimum | 79.7% | 84.3% |
| Maximum | 100.0% | 100.0% |
| Range | 20.3% | 15.7% |
| Mean | 92.6% | 95.5% |
| Median | 92.8% | 95.4% |
| Interquartile 25% (IQ1) | 89.7% | 94.0% |
| Interquartile 75% (IQ3) | 95.4% | 97.4% |
| Interquartile Range (IQR) | 5.7% | 3.4% |
| Standard Deviation (Sample) | 3.9% | 2.8% |
| Standard Deviation (Population) | 3.9% | 2.8% |
Similar Demographics by 11th Grade
Demographics Similar to Immigrants from Cameroon by 11th Grade
In terms of 11th grade, the demographic groups most similar to Immigrants from Cameroon are Immigrants from Panama (91.8%, a difference of 0.0%), Nigerian (91.8%, a difference of 0.010%), Immigrants from Afghanistan (91.8%, a difference of 0.030%), Choctaw (91.8%, a difference of 0.040%), and Immigrants from Somalia (91.9%, a difference of 0.050%).
| Demographics | Rating | Rank | 11th Grade |
| South American Indians | 7.6 /100 | #220 | Tragic 92.0% |
| Immigrants | Liberia | 7.0 /100 | #221 | Tragic 91.9% |
| Immigrants | Africa | 6.5 /100 | #222 | Tragic 91.9% |
| Immigrants | Bahamas | 6.5 /100 | #223 | Tragic 91.9% |
| Costa Ricans | 6.3 /100 | #224 | Tragic 91.9% |
| Immigrants | Zaire | 5.4 /100 | #225 | Tragic 91.9% |
| Immigrants | Somalia | 5.2 /100 | #226 | Tragic 91.9% |
| Immigrants | Cameroon | 4.4 /100 | #227 | Tragic 91.8% |
| Immigrants | Panama | 4.3 /100 | #228 | Tragic 91.8% |
| Nigerians | 4.3 /100 | #229 | Tragic 91.8% |
| Immigrants | Afghanistan | 3.9 /100 | #230 | Tragic 91.8% |
| Choctaw | 3.7 /100 | #231 | Tragic 91.8% |
| Uruguayans | 3.5 /100 | #232 | Tragic 91.8% |
| Cheyenne | 3.3 /100 | #233 | Tragic 91.8% |
| Armenians | 2.9 /100 | #234 | Tragic 91.7% |
Demographics Similar to Australians by 11th Grade
In terms of 11th grade, the demographic groups most similar to Australians are Immigrants from Ireland (94.1%, a difference of 0.010%), Serbian (94.1%, a difference of 0.010%), Greek (94.1%, a difference of 0.020%), Filipino (94.1%, a difference of 0.020%), and Macedonian (94.1%, a difference of 0.020%).
| Demographics | Rating | Rank | 11th Grade |
| Hungarians | 99.9 /100 | #38 | Exceptional 94.2% |
| Immigrants | Lithuania | 99.9 /100 | #39 | Exceptional 94.1% |
| Thais | 99.9 /100 | #40 | Exceptional 94.1% |
| Cypriots | 99.9 /100 | #41 | Exceptional 94.1% |
| Immigrants | Austria | 99.9 /100 | #42 | Exceptional 94.1% |
| Greeks | 99.9 /100 | #43 | Exceptional 94.1% |
| Immigrants | Ireland | 99.9 /100 | #44 | Exceptional 94.1% |
| Australians | 99.9 /100 | #45 | Exceptional 94.1% |
| Serbians | 99.9 /100 | #46 | Exceptional 94.1% |
| Filipinos | 99.9 /100 | #47 | Exceptional 94.1% |
| Macedonians | 99.9 /100 | #48 | Exceptional 94.1% |
| Slavs | 99.9 /100 | #49 | Exceptional 94.1% |
| French | 99.9 /100 | #50 | Exceptional 94.1% |
| Turks | 99.9 /100 | #51 | Exceptional 94.0% |
| Immigrants | Canada | 99.9 /100 | #52 | Exceptional 94.0% |