Immigrants from Cameroon vs Immigrants from Kenya No Schooling Completed
COMPARE
Immigrants from Cameroon
Immigrants from Kenya
No Schooling Completed
No Schooling Completed Comparison
Immigrants from Cameroon
Immigrants from Kenya
2.5%
NO SCHOOLING COMPLETED
0.1/ 100
METRIC RATING
273rd/ 347
METRIC RANK
2.1%
NO SCHOOLING COMPLETED
36.2/ 100
METRIC RATING
188th/ 347
METRIC RANK
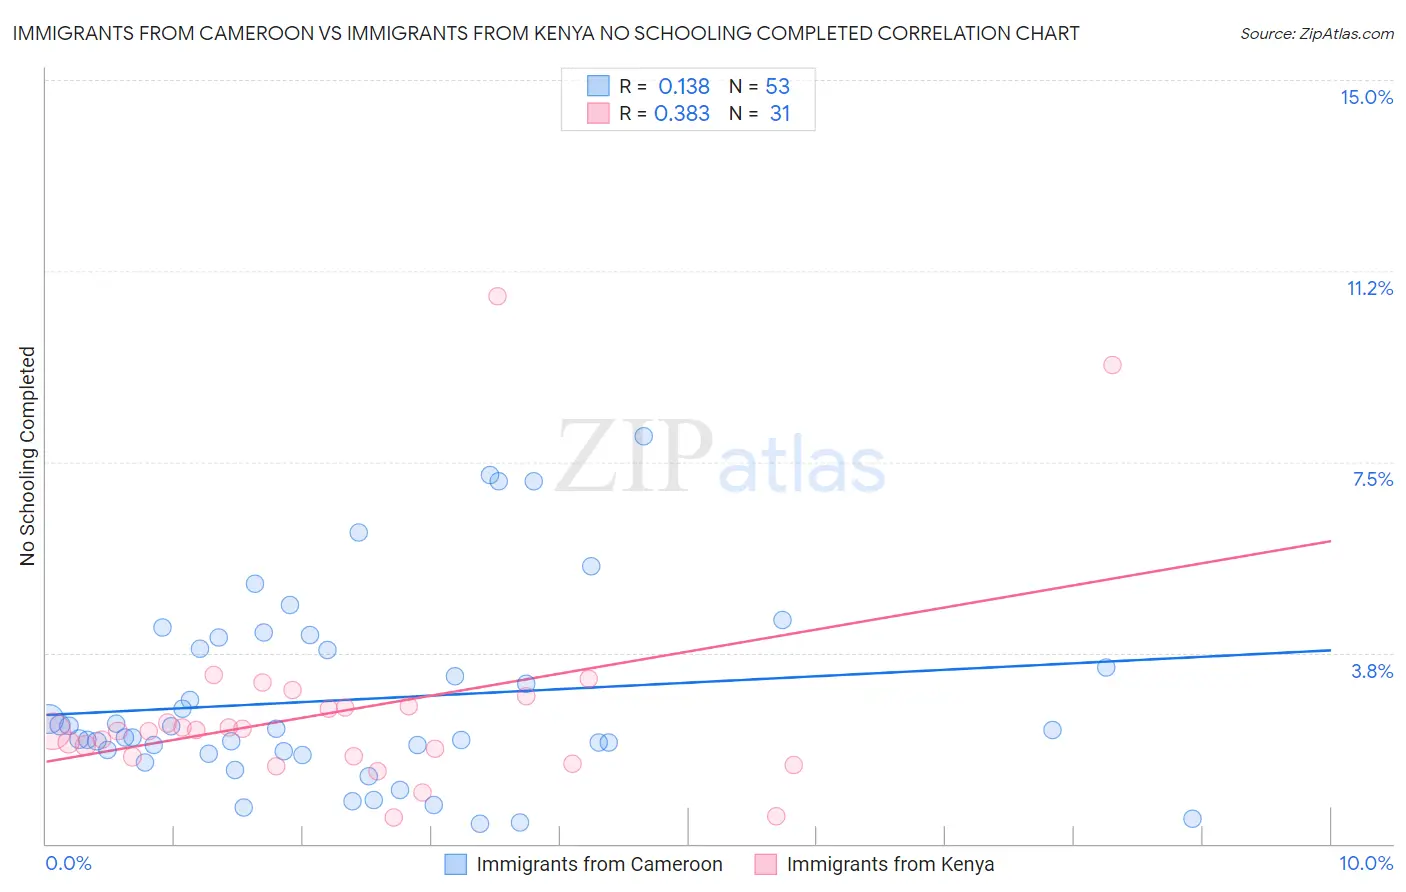
Immigrants from Cameroon vs Immigrants from Kenya No Schooling Completed Correlation Chart
The statistical analysis conducted on geographies consisting of 130,544,113 people shows a poor positive correlation between the proportion of Immigrants from Cameroon and percentage of population with no schooling in the United States with a correlation coefficient (R) of 0.138 and weighted average of 2.5%. Similarly, the statistical analysis conducted on geographies consisting of 217,120,357 people shows a mild positive correlation between the proportion of Immigrants from Kenya and percentage of population with no schooling in the United States with a correlation coefficient (R) of 0.383 and weighted average of 2.1%, a difference of 19.6%.
No Schooling Completed Correlation Summary
| Measurement | Immigrants from Cameroon | Immigrants from Kenya |
| Minimum | 0.38% | 0.53% |
| Maximum | 8.0% | 10.7% |
| Range | 7.6% | 10.2% |
| Mean | 2.8% | 2.6% |
| Median | 2.2% | 2.2% |
| Interquartile 25% (IQ1) | 1.8% | 1.7% |
| Interquartile 75% (IQ3) | 3.9% | 2.7% |
| Interquartile Range (IQR) | 2.1% | 0.99% |
| Standard Deviation (Sample) | 1.8% | 2.1% |
| Standard Deviation (Population) | 1.8% | 2.1% |
Similar Demographics by No Schooling Completed
Demographics Similar to Immigrants from Cameroon by No Schooling Completed
In terms of no schooling completed, the demographic groups most similar to Immigrants from Cameroon are Ghanaian (2.6%, a difference of 0.37%), Immigrants from China (2.6%, a difference of 0.56%), Immigrants from Bolivia (2.5%, a difference of 0.79%), Immigrants from Western Africa (2.6%, a difference of 1.1%), and Immigrants from Philippines (2.6%, a difference of 1.2%).
| Demographics | Rating | Rank | No Schooling Completed |
| Fijians | 0.4 /100 | #266 | Tragic 2.5% |
| Yuman | 0.4 /100 | #267 | Tragic 2.5% |
| Taiwanese | 0.3 /100 | #268 | Tragic 2.5% |
| Immigrants | Nigeria | 0.2 /100 | #269 | Tragic 2.5% |
| Immigrants | Peru | 0.2 /100 | #270 | Tragic 2.5% |
| Cubans | 0.2 /100 | #271 | Tragic 2.5% |
| Immigrants | Bolivia | 0.2 /100 | #272 | Tragic 2.5% |
| Immigrants | Cameroon | 0.1 /100 | #273 | Tragic 2.5% |
| Ghanaians | 0.1 /100 | #274 | Tragic 2.6% |
| Immigrants | China | 0.1 /100 | #275 | Tragic 2.6% |
| Immigrants | Western Africa | 0.1 /100 | #276 | Tragic 2.6% |
| Immigrants | Philippines | 0.1 /100 | #277 | Tragic 2.6% |
| Immigrants | Uzbekistan | 0.1 /100 | #278 | Tragic 2.6% |
| Barbadians | 0.1 /100 | #279 | Tragic 2.6% |
| Trinidadians and Tobagonians | 0.1 /100 | #280 | Tragic 2.6% |
Demographics Similar to Immigrants from Kenya by No Schooling Completed
In terms of no schooling completed, the demographic groups most similar to Immigrants from Kenya are Immigrants from Egypt (2.1%, a difference of 0.010%), Navajo (2.1%, a difference of 0.050%), Immigrants from Bosnia and Herzegovina (2.1%, a difference of 0.35%), Spanish American (2.1%, a difference of 0.52%), and Mongolian (2.1%, a difference of 0.65%).
| Demographics | Rating | Rank | No Schooling Completed |
| Immigrants | Taiwan | 42.6 /100 | #181 | Average 2.1% |
| French American Indians | 42.2 /100 | #182 | Average 2.1% |
| Blacks/African Americans | 41.4 /100 | #183 | Average 2.1% |
| Pima | 41.3 /100 | #184 | Average 2.1% |
| Mongolians | 40.8 /100 | #185 | Average 2.1% |
| Immigrants | Bosnia and Herzegovina | 38.6 /100 | #186 | Fair 2.1% |
| Navajo | 36.5 /100 | #187 | Fair 2.1% |
| Immigrants | Kenya | 36.2 /100 | #188 | Fair 2.1% |
| Immigrants | Egypt | 36.1 /100 | #189 | Fair 2.1% |
| Spanish Americans | 32.6 /100 | #190 | Fair 2.1% |
| Bermudans | 30.7 /100 | #191 | Fair 2.1% |
| Guamanians/Chamorros | 29.8 /100 | #192 | Fair 2.2% |
| Paraguayans | 29.3 /100 | #193 | Fair 2.2% |
| Immigrants | Albania | 28.3 /100 | #194 | Fair 2.2% |
| Hawaiians | 27.0 /100 | #195 | Fair 2.2% |