Uruguayan vs Immigrants from Kenya No Schooling Completed
COMPARE
Uruguayan
Immigrants from Kenya
No Schooling Completed
No Schooling Completed Comparison
Uruguayans
Immigrants from Kenya
2.2%
NO SCHOOLING COMPLETED
11.0/ 100
METRIC RATING
208th/ 347
METRIC RANK
2.1%
NO SCHOOLING COMPLETED
36.2/ 100
METRIC RATING
188th/ 347
METRIC RANK
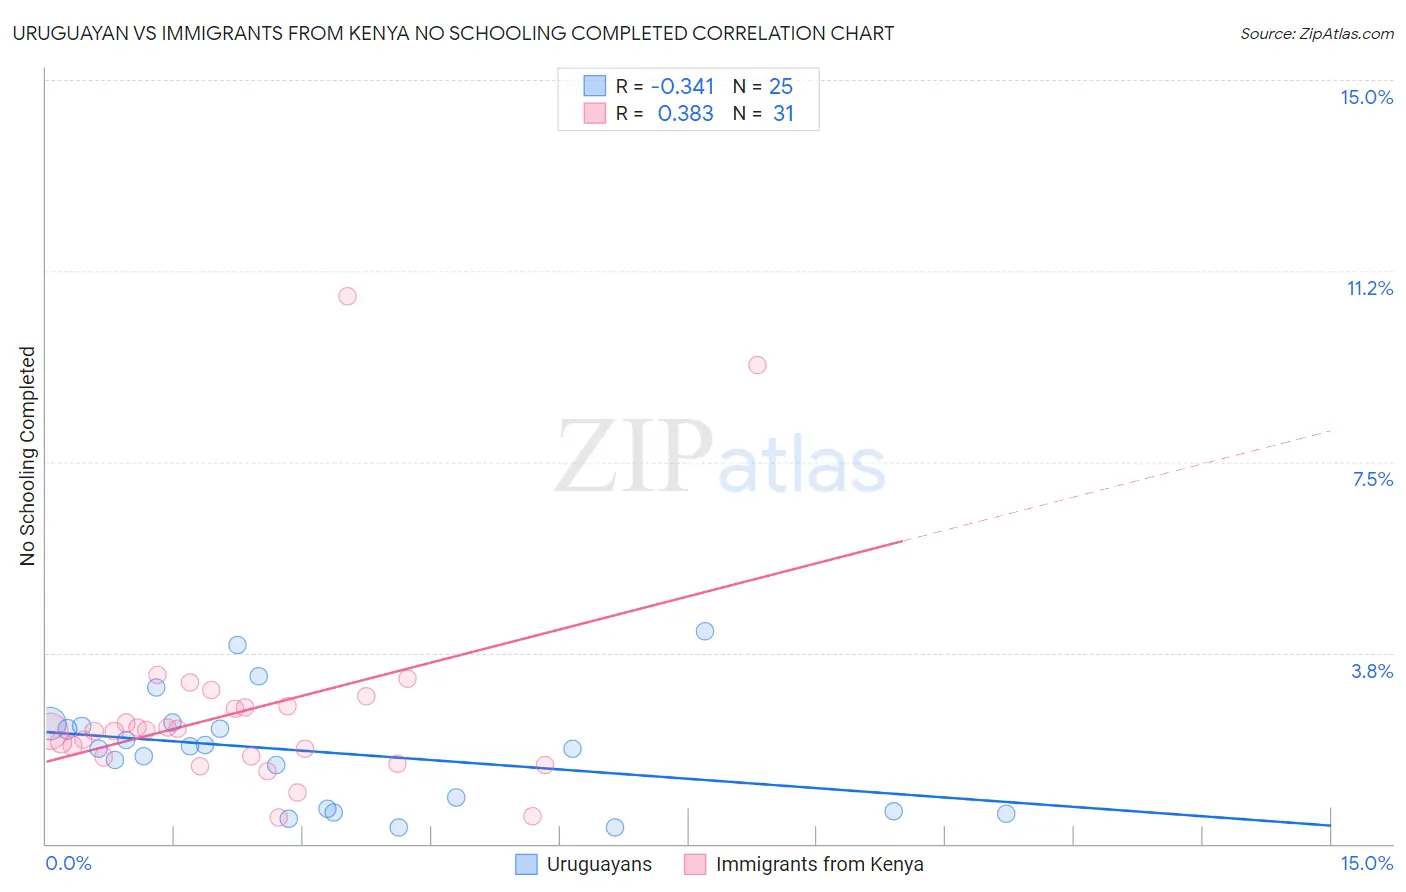
Uruguayan vs Immigrants from Kenya No Schooling Completed Correlation Chart
The statistical analysis conducted on geographies consisting of 144,399,901 people shows a mild negative correlation between the proportion of Uruguayans and percentage of population with no schooling in the United States with a correlation coefficient (R) of -0.341 and weighted average of 2.2%. Similarly, the statistical analysis conducted on geographies consisting of 217,120,357 people shows a mild positive correlation between the proportion of Immigrants from Kenya and percentage of population with no schooling in the United States with a correlation coefficient (R) of 0.383 and weighted average of 2.1%, a difference of 5.0%.
No Schooling Completed Correlation Summary
| Measurement | Uruguayan | Immigrants from Kenya |
| Minimum | 0.31% | 0.53% |
| Maximum | 4.2% | 10.7% |
| Range | 3.9% | 10.2% |
| Mean | 1.8% | 2.6% |
| Median | 1.9% | 2.2% |
| Interquartile 25% (IQ1) | 0.65% | 1.7% |
| Interquartile 75% (IQ3) | 2.3% | 2.7% |
| Interquartile Range (IQR) | 1.7% | 0.99% |
| Standard Deviation (Sample) | 1.1% | 2.1% |
| Standard Deviation (Population) | 1.1% | 2.1% |
Demographics Similar to Uruguayans and Immigrants from Kenya by No Schooling Completed
In terms of no schooling completed, the demographic groups most similar to Uruguayans are South American Indian (2.2%, a difference of 0.0%), Immigrants from Bahamas (2.2%, a difference of 0.19%), Bahamian (2.2%, a difference of 0.19%), Hopi (2.2%, a difference of 0.59%), and Laotian (2.2%, a difference of 0.70%). Similarly, the demographic groups most similar to Immigrants from Kenya are Immigrants from Egypt (2.1%, a difference of 0.010%), Spanish American (2.1%, a difference of 0.52%), Bermudan (2.1%, a difference of 0.81%), Guamanian/Chamorro (2.2%, a difference of 0.95%), and Paraguayan (2.2%, a difference of 1.0%).
| Demographics | Rating | Rank | No Schooling Completed |
| Immigrants | Kenya | 36.2 /100 | #188 | Fair 2.1% |
| Immigrants | Egypt | 36.1 /100 | #189 | Fair 2.1% |
| Spanish Americans | 32.6 /100 | #190 | Fair 2.1% |
| Bermudans | 30.7 /100 | #191 | Fair 2.1% |
| Guamanians/Chamorros | 29.8 /100 | #192 | Fair 2.2% |
| Paraguayans | 29.3 /100 | #193 | Fair 2.2% |
| Immigrants | Albania | 28.3 /100 | #194 | Fair 2.2% |
| Hawaiians | 27.0 /100 | #195 | Fair 2.2% |
| Immigrants | Ukraine | 26.1 /100 | #196 | Fair 2.2% |
| Immigrants | Southern Europe | 23.8 /100 | #197 | Fair 2.2% |
| Immigrants | Chile | 22.7 /100 | #198 | Fair 2.2% |
| Africans | 21.8 /100 | #199 | Fair 2.2% |
| Immigrants | Northern Africa | 19.5 /100 | #200 | Poor 2.2% |
| Costa Ricans | 17.1 /100 | #201 | Poor 2.2% |
| Moroccans | 13.7 /100 | #202 | Poor 2.2% |
| Laotians | 13.3 /100 | #203 | Poor 2.2% |
| Hopi | 12.9 /100 | #204 | Poor 2.2% |
| Immigrants | Bahamas | 11.6 /100 | #205 | Poor 2.2% |
| Bahamians | 11.6 /100 | #206 | Poor 2.2% |
| South American Indians | 11.0 /100 | #207 | Poor 2.2% |
| Uruguayans | 11.0 /100 | #208 | Poor 2.2% |