Immigrants from Cameroon vs Immigrants from Central America No Schooling Completed
COMPARE
Immigrants from Cameroon
Immigrants from Central America
No Schooling Completed
No Schooling Completed Comparison
Immigrants from Cameroon
Immigrants from Central America
2.5%
NO SCHOOLING COMPLETED
0.1/ 100
METRIC RATING
273rd/ 347
METRIC RANK
3.6%
NO SCHOOLING COMPLETED
0.0/ 100
METRIC RATING
341st/ 347
METRIC RANK
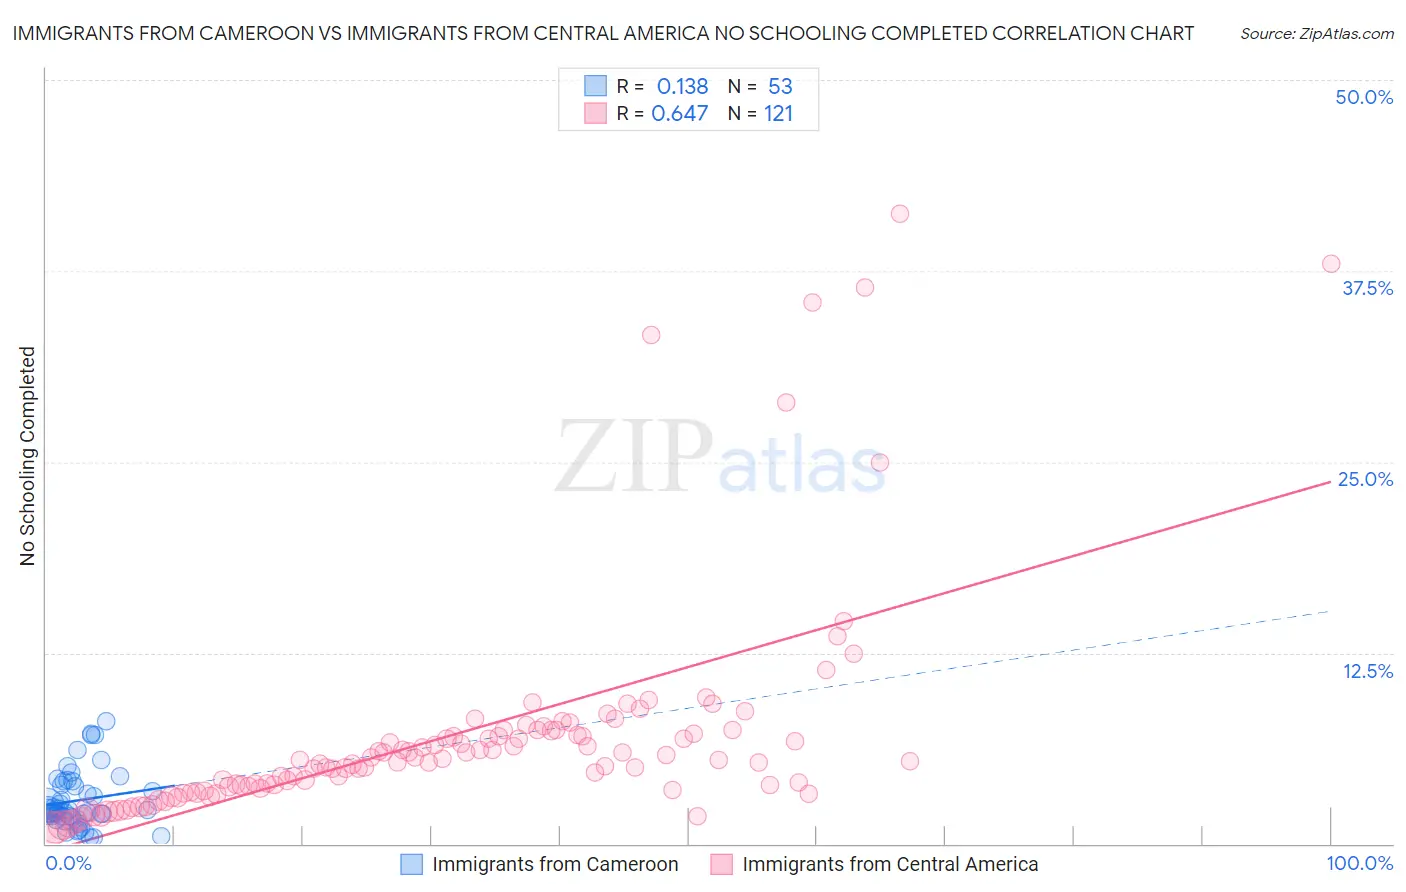
Immigrants from Cameroon vs Immigrants from Central America No Schooling Completed Correlation Chart
The statistical analysis conducted on geographies consisting of 130,544,113 people shows a poor positive correlation between the proportion of Immigrants from Cameroon and percentage of population with no schooling in the United States with a correlation coefficient (R) of 0.138 and weighted average of 2.5%. Similarly, the statistical analysis conducted on geographies consisting of 525,518,504 people shows a significant positive correlation between the proportion of Immigrants from Central America and percentage of population with no schooling in the United States with a correlation coefficient (R) of 0.647 and weighted average of 3.6%, a difference of 41.8%.
No Schooling Completed Correlation Summary
| Measurement | Immigrants from Cameroon | Immigrants from Central America |
| Minimum | 0.38% | 1.0% |
| Maximum | 8.0% | 41.2% |
| Range | 7.6% | 40.2% |
| Mean | 2.8% | 7.0% |
| Median | 2.2% | 5.4% |
| Interquartile 25% (IQ1) | 1.8% | 3.6% |
| Interquartile 75% (IQ3) | 3.9% | 7.3% |
| Interquartile Range (IQR) | 2.1% | 3.7% |
| Standard Deviation (Sample) | 1.8% | 7.3% |
| Standard Deviation (Population) | 1.8% | 7.3% |
Similar Demographics by No Schooling Completed
Demographics Similar to Immigrants from Cameroon by No Schooling Completed
In terms of no schooling completed, the demographic groups most similar to Immigrants from Cameroon are Ghanaian (2.6%, a difference of 0.37%), Immigrants from China (2.6%, a difference of 0.56%), Immigrants from Bolivia (2.5%, a difference of 0.79%), Immigrants from Western Africa (2.6%, a difference of 1.1%), and Immigrants from Philippines (2.6%, a difference of 1.2%).
| Demographics | Rating | Rank | No Schooling Completed |
| Fijians | 0.4 /100 | #266 | Tragic 2.5% |
| Yuman | 0.4 /100 | #267 | Tragic 2.5% |
| Taiwanese | 0.3 /100 | #268 | Tragic 2.5% |
| Immigrants | Nigeria | 0.2 /100 | #269 | Tragic 2.5% |
| Immigrants | Peru | 0.2 /100 | #270 | Tragic 2.5% |
| Cubans | 0.2 /100 | #271 | Tragic 2.5% |
| Immigrants | Bolivia | 0.2 /100 | #272 | Tragic 2.5% |
| Immigrants | Cameroon | 0.1 /100 | #273 | Tragic 2.5% |
| Ghanaians | 0.1 /100 | #274 | Tragic 2.6% |
| Immigrants | China | 0.1 /100 | #275 | Tragic 2.6% |
| Immigrants | Western Africa | 0.1 /100 | #276 | Tragic 2.6% |
| Immigrants | Philippines | 0.1 /100 | #277 | Tragic 2.6% |
| Immigrants | Uzbekistan | 0.1 /100 | #278 | Tragic 2.6% |
| Barbadians | 0.1 /100 | #279 | Tragic 2.6% |
| Trinidadians and Tobagonians | 0.1 /100 | #280 | Tragic 2.6% |
Demographics Similar to Immigrants from Central America by No Schooling Completed
In terms of no schooling completed, the demographic groups most similar to Immigrants from Central America are Immigrants from Mexico (3.6%, a difference of 0.84%), Immigrants from Guatemala (3.6%, a difference of 1.1%), Yakama (3.6%, a difference of 1.7%), Bangladeshi (3.5%, a difference of 2.1%), and Immigrants from Cabo Verde (3.5%, a difference of 2.3%).
| Demographics | Rating | Rank | No Schooling Completed |
| Immigrants | Dominican Republic | 0.0 /100 | #333 | Tragic 3.4% |
| Guatemalans | 0.0 /100 | #334 | Tragic 3.5% |
| Immigrants | Cambodia | 0.0 /100 | #335 | Tragic 3.5% |
| Immigrants | Fiji | 0.0 /100 | #336 | Tragic 3.5% |
| Immigrants | Cabo Verde | 0.0 /100 | #337 | Tragic 3.5% |
| Bangladeshis | 0.0 /100 | #338 | Tragic 3.5% |
| Yakama | 0.0 /100 | #339 | Tragic 3.6% |
| Immigrants | Guatemala | 0.0 /100 | #340 | Tragic 3.6% |
| Immigrants | Central America | 0.0 /100 | #341 | Tragic 3.6% |
| Immigrants | Mexico | 0.0 /100 | #342 | Tragic 3.6% |
| Salvadorans | 0.0 /100 | #343 | Tragic 3.7% |
| Nepalese | 0.0 /100 | #344 | Tragic 3.8% |
| Immigrants | El Salvador | 0.0 /100 | #345 | Tragic 3.9% |
| Immigrants | Yemen | 0.0 /100 | #346 | Tragic 4.1% |
| Spanish American Indians | 0.0 /100 | #347 | Tragic 4.2% |