Immigrants from Cameroon vs Hispanic or Latino GED/Equivalency
COMPARE
Immigrants from Cameroon
Hispanic or Latino
GED/Equivalency
GED/Equivalency Comparison
Immigrants from Cameroon
Hispanics or Latinos
84.9%
GED/EQUIVALENCY
12.1/ 100
METRIC RATING
210th/ 347
METRIC RANK
79.1%
GED/EQUIVALENCY
0.0/ 100
METRIC RATING
328th/ 347
METRIC RANK
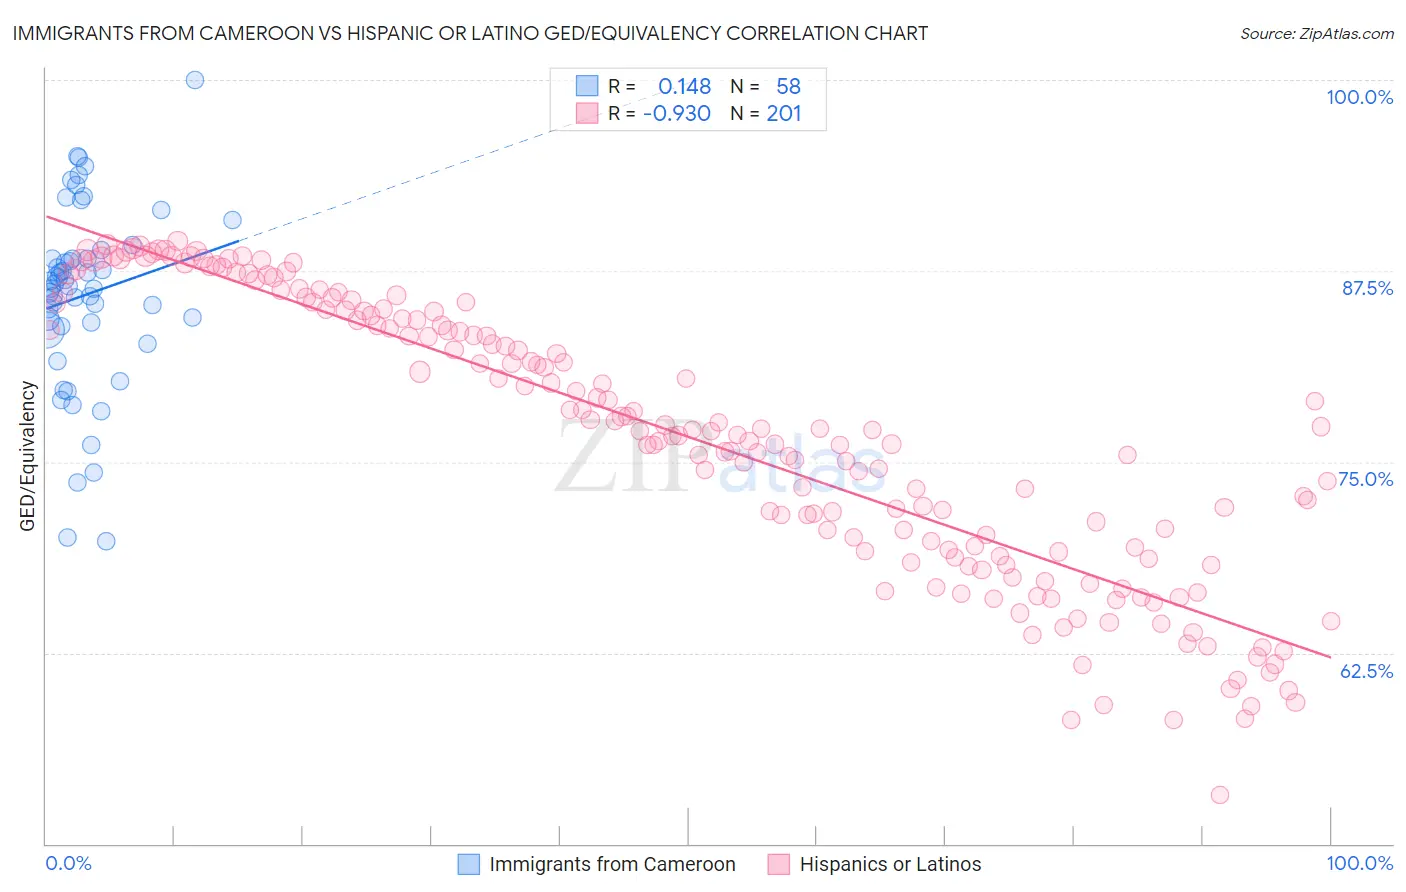
Immigrants from Cameroon vs Hispanic or Latino GED/Equivalency Correlation Chart
The statistical analysis conducted on geographies consisting of 130,768,734 people shows a poor positive correlation between the proportion of Immigrants from Cameroon and percentage of population with at least ged/equivalency education in the United States with a correlation coefficient (R) of 0.148 and weighted average of 84.9%. Similarly, the statistical analysis conducted on geographies consisting of 578,611,870 people shows a near-perfect negative correlation between the proportion of Hispanics or Latinos and percentage of population with at least ged/equivalency education in the United States with a correlation coefficient (R) of -0.930 and weighted average of 79.1%, a difference of 7.3%.
GED/Equivalency Correlation Summary
| Measurement | Immigrants from Cameroon | Hispanic or Latino |
| Minimum | 69.8% | 53.2% |
| Maximum | 100.0% | 89.5% |
| Range | 30.2% | 36.2% |
| Mean | 85.9% | 76.6% |
| Median | 86.6% | 77.1% |
| Interquartile 25% (IQ1) | 83.8% | 69.1% |
| Interquartile 75% (IQ3) | 88.3% | 84.9% |
| Interquartile Range (IQR) | 4.5% | 15.7% |
| Standard Deviation (Sample) | 6.0% | 9.0% |
| Standard Deviation (Population) | 5.9% | 9.0% |
Similar Demographics by GED/Equivalency
Demographics Similar to Immigrants from Cameroon by GED/Equivalency
In terms of ged/equivalency, the demographic groups most similar to Immigrants from Cameroon are Colombian (84.9%, a difference of 0.010%), Marshallese (84.9%, a difference of 0.020%), Hmong (84.9%, a difference of 0.050%), South American (84.8%, a difference of 0.060%), and Samoan (84.9%, a difference of 0.070%).
| Demographics | Rating | Rank | GED/Equivalency |
| Panamanians | 15.3 /100 | #203 | Poor 85.0% |
| Hawaiians | 15.2 /100 | #204 | Poor 85.0% |
| Liberians | 14.6 /100 | #205 | Poor 85.0% |
| Samoans | 13.7 /100 | #206 | Poor 84.9% |
| Hmong | 13.1 /100 | #207 | Poor 84.9% |
| Marshallese | 12.5 /100 | #208 | Poor 84.9% |
| Colombians | 12.3 /100 | #209 | Poor 84.9% |
| Immigrants | Cameroon | 12.1 /100 | #210 | Poor 84.9% |
| South Americans | 10.9 /100 | #211 | Poor 84.8% |
| Immigrants | Somalia | 10.6 /100 | #212 | Poor 84.8% |
| Immigrants | Philippines | 10.0 /100 | #213 | Poor 84.8% |
| Osage | 9.5 /100 | #214 | Tragic 84.8% |
| Peruvians | 9.2 /100 | #215 | Tragic 84.7% |
| Immigrants | Micronesia | 8.7 /100 | #216 | Tragic 84.7% |
| Nigerians | 8.6 /100 | #217 | Tragic 84.7% |
Demographics Similar to Hispanics or Latinos by GED/Equivalency
In terms of ged/equivalency, the demographic groups most similar to Hispanics or Latinos are Dominican (79.1%, a difference of 0.050%), Central American (79.2%, a difference of 0.10%), Yuman (79.2%, a difference of 0.13%), Immigrants from Cabo Verde (78.9%, a difference of 0.20%), and Honduran (79.3%, a difference of 0.22%).
| Demographics | Rating | Rank | GED/Equivalency |
| Yup'ik | 0.0 /100 | #321 | Tragic 80.0% |
| Lumbee | 0.0 /100 | #322 | Tragic 80.0% |
| Immigrants | Nicaragua | 0.0 /100 | #323 | Tragic 79.9% |
| Mexican American Indians | 0.0 /100 | #324 | Tragic 79.4% |
| Hondurans | 0.0 /100 | #325 | Tragic 79.3% |
| Yuman | 0.0 /100 | #326 | Tragic 79.2% |
| Central Americans | 0.0 /100 | #327 | Tragic 79.2% |
| Hispanics or Latinos | 0.0 /100 | #328 | Tragic 79.1% |
| Dominicans | 0.0 /100 | #329 | Tragic 79.1% |
| Immigrants | Cabo Verde | 0.0 /100 | #330 | Tragic 78.9% |
| Immigrants | Honduras | 0.0 /100 | #331 | Tragic 78.7% |
| Immigrants | Azores | 0.0 /100 | #332 | Tragic 78.7% |
| Salvadorans | 0.0 /100 | #333 | Tragic 78.6% |
| Guatemalans | 0.0 /100 | #334 | Tragic 78.5% |
| Immigrants | Latin America | 0.0 /100 | #335 | Tragic 78.5% |