Immigrants from Cambodia vs Yakama Bachelor's Degree
COMPARE
Immigrants from Cambodia
Yakama
Bachelor's Degree
Bachelor's Degree Comparison
Immigrants from Cambodia
Yakama
34.2%
BACHELOR'S DEGREE
1.9/ 100
METRIC RATING
241st/ 347
METRIC RANK
24.5%
BACHELOR'S DEGREE
0.0/ 100
METRIC RATING
342nd/ 347
METRIC RANK
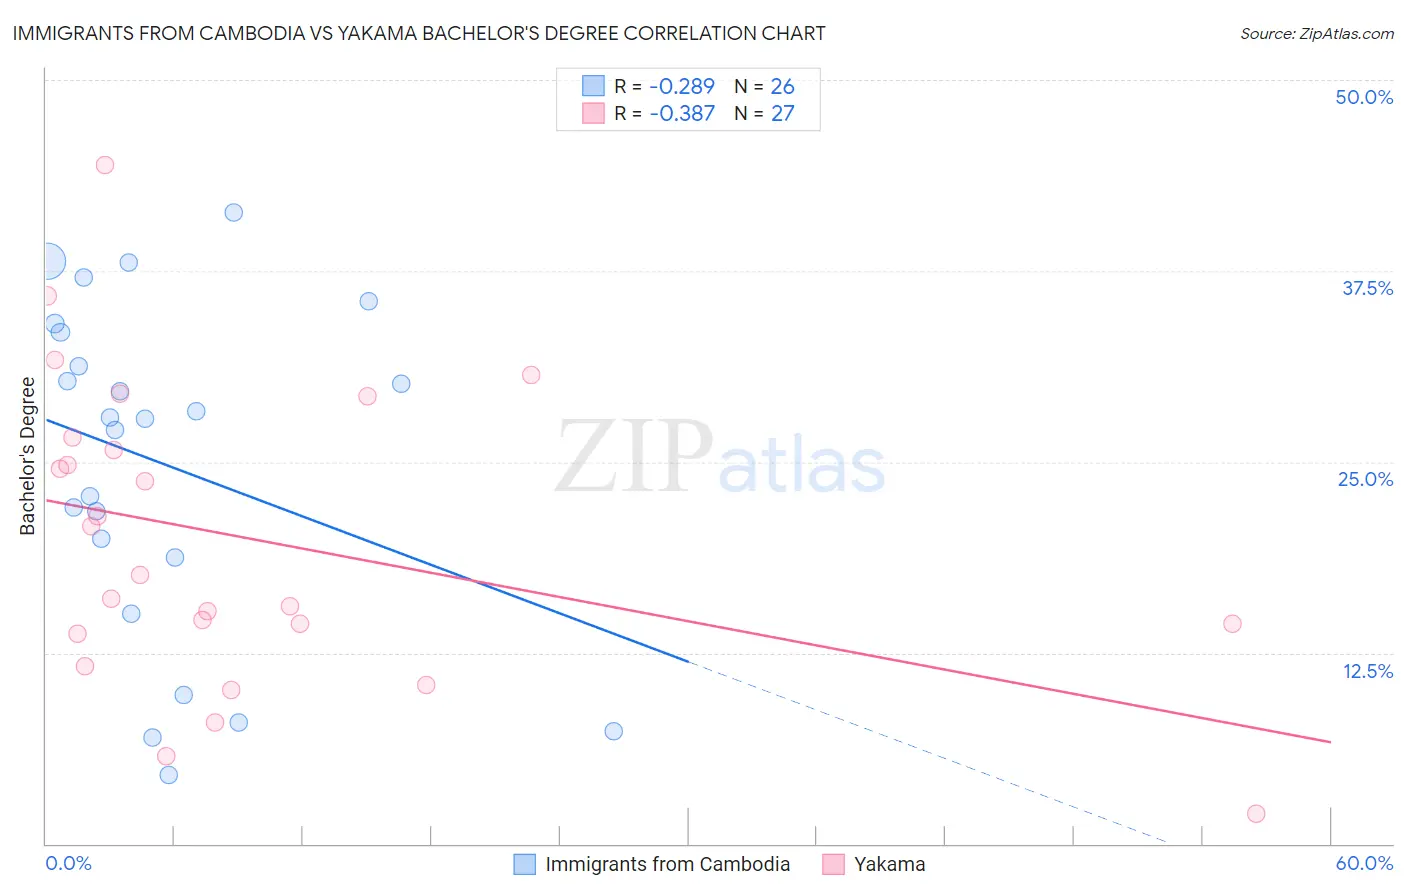
Immigrants from Cambodia vs Yakama Bachelor's Degree Correlation Chart
The statistical analysis conducted on geographies consisting of 205,152,160 people shows a weak negative correlation between the proportion of Immigrants from Cambodia and percentage of population with at least bachelor's degree education in the United States with a correlation coefficient (R) of -0.289 and weighted average of 34.2%. Similarly, the statistical analysis conducted on geographies consisting of 19,923,144 people shows a mild negative correlation between the proportion of Yakama and percentage of population with at least bachelor's degree education in the United States with a correlation coefficient (R) of -0.387 and weighted average of 24.5%, a difference of 39.7%.
Bachelor's Degree Correlation Summary
| Measurement | Immigrants from Cambodia | Yakama |
| Minimum | 4.5% | 1.9% |
| Maximum | 41.4% | 44.4% |
| Range | 36.9% | 42.5% |
| Mean | 24.9% | 19.9% |
| Median | 27.9% | 17.6% |
| Interquartile 25% (IQ1) | 18.8% | 13.8% |
| Interquartile 75% (IQ3) | 33.5% | 26.6% |
| Interquartile Range (IQR) | 14.7% | 12.8% |
| Standard Deviation (Sample) | 10.8% | 9.9% |
| Standard Deviation (Population) | 10.6% | 9.7% |
Similar Demographics by Bachelor's Degree
Demographics Similar to Immigrants from Cambodia by Bachelor's Degree
In terms of bachelor's degree, the demographic groups most similar to Immigrants from Cambodia are Nonimmigrants (34.2%, a difference of 0.060%), Tongan (34.3%, a difference of 0.26%), Immigrants from Guyana (33.9%, a difference of 0.71%), British West Indian (34.5%, a difference of 0.80%), and Guyanese (34.5%, a difference of 0.82%).
| Demographics | Rating | Rank | Bachelor's Degree |
| Guamanians/Chamorros | 3.0 /100 | #234 | Tragic 34.6% |
| Immigrants | West Indies | 2.9 /100 | #235 | Tragic 34.6% |
| Liberians | 2.8 /100 | #236 | Tragic 34.6% |
| Tlingit-Haida | 2.8 /100 | #237 | Tragic 34.6% |
| Guyanese | 2.5 /100 | #238 | Tragic 34.5% |
| British West Indians | 2.5 /100 | #239 | Tragic 34.5% |
| Tongans | 2.0 /100 | #240 | Tragic 34.3% |
| Immigrants | Cambodia | 1.9 /100 | #241 | Tragic 34.2% |
| Immigrants | Nonimmigrants | 1.8 /100 | #242 | Tragic 34.2% |
| Immigrants | Guyana | 1.4 /100 | #243 | Tragic 33.9% |
| Delaware | 1.2 /100 | #244 | Tragic 33.8% |
| Immigrants | Fiji | 1.2 /100 | #245 | Tragic 33.7% |
| Jamaicans | 1.0 /100 | #246 | Tragic 33.6% |
| Immigrants | Congo | 1.0 /100 | #247 | Tragic 33.6% |
| Cree | 1.0 /100 | #248 | Tragic 33.6% |
Demographics Similar to Yakama by Bachelor's Degree
In terms of bachelor's degree, the demographic groups most similar to Yakama are Tohono O'odham (24.4%, a difference of 0.20%), Yuman (24.5%, a difference of 0.27%), Lumbee (24.8%, a difference of 1.2%), Hopi (25.3%, a difference of 3.4%), and Navajo (23.6%, a difference of 3.6%).
| Demographics | Rating | Rank | Bachelor's Degree |
| Mexicans | 0.0 /100 | #333 | Tragic 27.1% |
| Arapaho | 0.0 /100 | #334 | Tragic 26.6% |
| Natives/Alaskans | 0.0 /100 | #335 | Tragic 26.3% |
| Immigrants | Mexico | 0.0 /100 | #336 | Tragic 26.1% |
| Inupiat | 0.0 /100 | #337 | Tragic 25.8% |
| Pueblo | 0.0 /100 | #338 | Tragic 25.5% |
| Hopi | 0.0 /100 | #339 | Tragic 25.3% |
| Lumbee | 0.0 /100 | #340 | Tragic 24.8% |
| Yuman | 0.0 /100 | #341 | Tragic 24.5% |
| Yakama | 0.0 /100 | #342 | Tragic 24.5% |
| Tohono O'odham | 0.0 /100 | #343 | Tragic 24.4% |
| Navajo | 0.0 /100 | #344 | Tragic 23.6% |
| Pima | 0.0 /100 | #345 | Tragic 23.2% |
| Houma | 0.0 /100 | #346 | Tragic 21.4% |
| Yup'ik | 0.0 /100 | #347 | Tragic 19.4% |