Immigrants from Lebanon vs Yakama Bachelor's Degree
COMPARE
Immigrants from Lebanon
Yakama
Bachelor's Degree
Bachelor's Degree Comparison
Immigrants from Lebanon
Yakama
42.4%
BACHELOR'S DEGREE
99.3/ 100
METRIC RATING
79th/ 347
METRIC RANK
24.5%
BACHELOR'S DEGREE
0.0/ 100
METRIC RATING
342nd/ 347
METRIC RANK
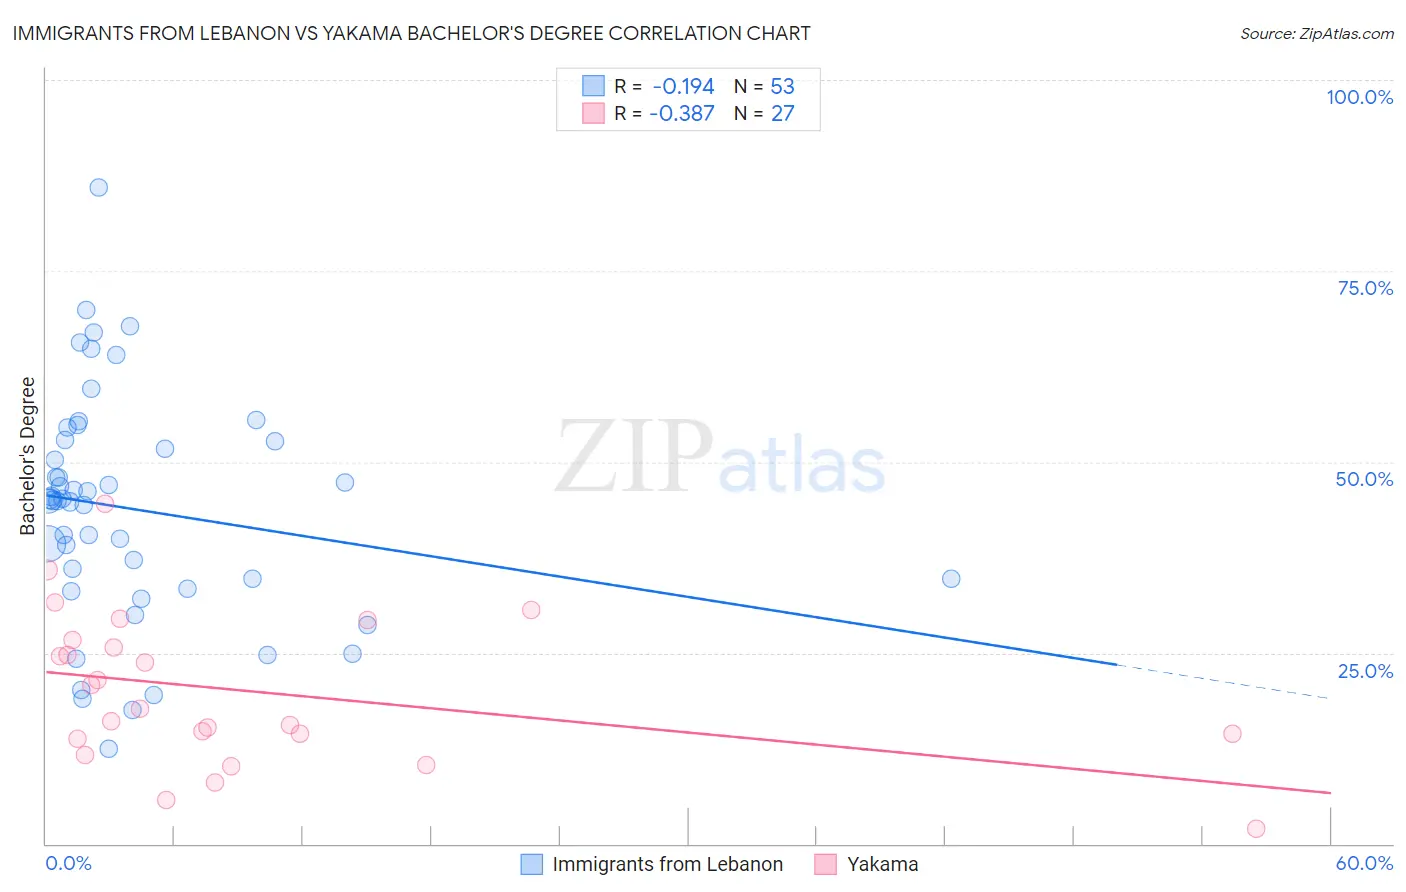
Immigrants from Lebanon vs Yakama Bachelor's Degree Correlation Chart
The statistical analysis conducted on geographies consisting of 217,160,107 people shows a poor negative correlation between the proportion of Immigrants from Lebanon and percentage of population with at least bachelor's degree education in the United States with a correlation coefficient (R) of -0.194 and weighted average of 42.4%. Similarly, the statistical analysis conducted on geographies consisting of 19,923,144 people shows a mild negative correlation between the proportion of Yakama and percentage of population with at least bachelor's degree education in the United States with a correlation coefficient (R) of -0.387 and weighted average of 24.5%, a difference of 73.3%.
Bachelor's Degree Correlation Summary
| Measurement | Immigrants from Lebanon | Yakama |
| Minimum | 12.4% | 1.9% |
| Maximum | 86.0% | 44.4% |
| Range | 73.5% | 42.5% |
| Mean | 43.8% | 19.9% |
| Median | 45.0% | 17.6% |
| Interquartile 25% (IQ1) | 34.0% | 13.8% |
| Interquartile 75% (IQ3) | 52.8% | 26.6% |
| Interquartile Range (IQR) | 18.8% | 12.8% |
| Standard Deviation (Sample) | 15.0% | 9.9% |
| Standard Deviation (Population) | 14.8% | 9.7% |
Similar Demographics by Bachelor's Degree
Demographics Similar to Immigrants from Lebanon by Bachelor's Degree
In terms of bachelor's degree, the demographic groups most similar to Immigrants from Lebanon are Immigrants from Ethiopia (42.5%, a difference of 0.17%), Immigrants from Croatia (42.3%, a difference of 0.20%), Immigrants from Hungary (42.3%, a difference of 0.21%), Immigrants from Eastern Europe (42.5%, a difference of 0.23%), and Immigrants from Scotland (42.3%, a difference of 0.28%).
| Demographics | Rating | Rank | Bachelor's Degree |
| Ethiopians | 99.5 /100 | #72 | Exceptional 42.8% |
| Immigrants | Uzbekistan | 99.5 /100 | #73 | Exceptional 42.8% |
| Bhutanese | 99.5 /100 | #74 | Exceptional 42.7% |
| Immigrants | Zimbabwe | 99.4 /100 | #75 | Exceptional 42.6% |
| Immigrants | Egypt | 99.4 /100 | #76 | Exceptional 42.6% |
| Immigrants | Eastern Europe | 99.4 /100 | #77 | Exceptional 42.5% |
| Immigrants | Ethiopia | 99.4 /100 | #78 | Exceptional 42.5% |
| Immigrants | Lebanon | 99.3 /100 | #79 | Exceptional 42.4% |
| Immigrants | Croatia | 99.2 /100 | #80 | Exceptional 42.3% |
| Immigrants | Hungary | 99.2 /100 | #81 | Exceptional 42.3% |
| Immigrants | Scotland | 99.2 /100 | #82 | Exceptional 42.3% |
| Armenians | 99.2 /100 | #83 | Exceptional 42.3% |
| Immigrants | Western Asia | 99.2 /100 | #84 | Exceptional 42.3% |
| Lithuanians | 99.2 /100 | #85 | Exceptional 42.2% |
| Immigrants | Brazil | 99.2 /100 | #86 | Exceptional 42.2% |
Demographics Similar to Yakama by Bachelor's Degree
In terms of bachelor's degree, the demographic groups most similar to Yakama are Tohono O'odham (24.4%, a difference of 0.20%), Yuman (24.5%, a difference of 0.27%), Lumbee (24.8%, a difference of 1.2%), Hopi (25.3%, a difference of 3.4%), and Navajo (23.6%, a difference of 3.6%).
| Demographics | Rating | Rank | Bachelor's Degree |
| Mexicans | 0.0 /100 | #333 | Tragic 27.1% |
| Arapaho | 0.0 /100 | #334 | Tragic 26.6% |
| Natives/Alaskans | 0.0 /100 | #335 | Tragic 26.3% |
| Immigrants | Mexico | 0.0 /100 | #336 | Tragic 26.1% |
| Inupiat | 0.0 /100 | #337 | Tragic 25.8% |
| Pueblo | 0.0 /100 | #338 | Tragic 25.5% |
| Hopi | 0.0 /100 | #339 | Tragic 25.3% |
| Lumbee | 0.0 /100 | #340 | Tragic 24.8% |
| Yuman | 0.0 /100 | #341 | Tragic 24.5% |
| Yakama | 0.0 /100 | #342 | Tragic 24.5% |
| Tohono O'odham | 0.0 /100 | #343 | Tragic 24.4% |
| Navajo | 0.0 /100 | #344 | Tragic 23.6% |
| Pima | 0.0 /100 | #345 | Tragic 23.2% |
| Houma | 0.0 /100 | #346 | Tragic 21.4% |
| Yup'ik | 0.0 /100 | #347 | Tragic 19.4% |