Immigrants from India vs Yakama Bachelor's Degree
COMPARE
Immigrants from India
Yakama
Bachelor's Degree
Bachelor's Degree Comparison
Immigrants from India
Yakama
51.3%
BACHELOR'S DEGREE
100.0/ 100
METRIC RATING
3rd/ 347
METRIC RANK
24.5%
BACHELOR'S DEGREE
0.0/ 100
METRIC RATING
342nd/ 347
METRIC RANK
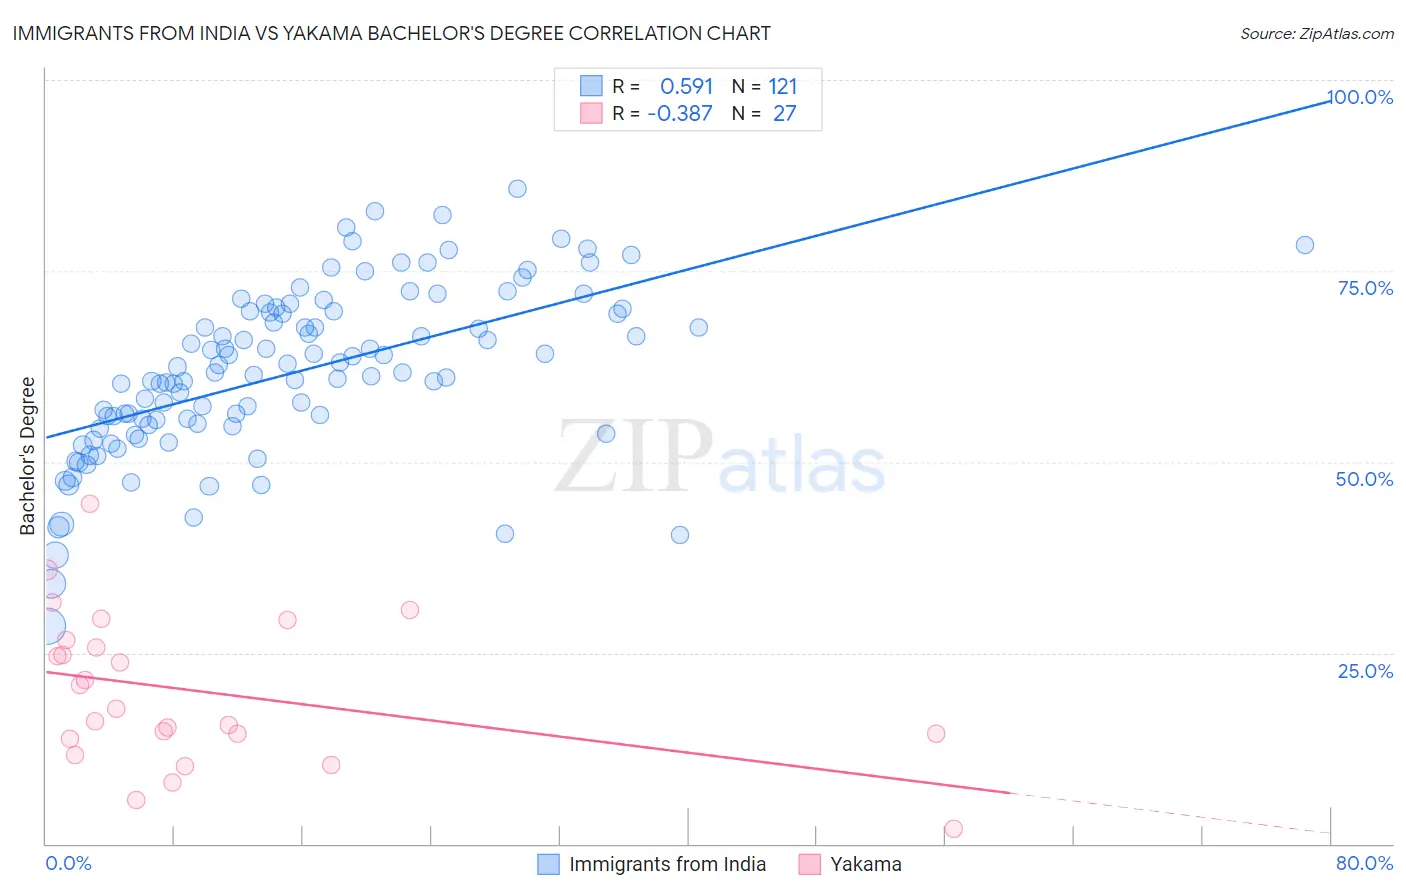
Immigrants from India vs Yakama Bachelor's Degree Correlation Chart
The statistical analysis conducted on geographies consisting of 434,046,114 people shows a substantial positive correlation between the proportion of Immigrants from India and percentage of population with at least bachelor's degree education in the United States with a correlation coefficient (R) of 0.591 and weighted average of 51.3%. Similarly, the statistical analysis conducted on geographies consisting of 19,923,144 people shows a mild negative correlation between the proportion of Yakama and percentage of population with at least bachelor's degree education in the United States with a correlation coefficient (R) of -0.387 and weighted average of 24.5%, a difference of 109.6%.
Bachelor's Degree Correlation Summary
| Measurement | Immigrants from India | Yakama |
| Minimum | 28.5% | 1.9% |
| Maximum | 85.7% | 44.4% |
| Range | 57.2% | 42.5% |
| Mean | 61.6% | 19.9% |
| Median | 61.8% | 17.6% |
| Interquartile 25% (IQ1) | 54.8% | 13.8% |
| Interquartile 75% (IQ3) | 69.7% | 26.6% |
| Interquartile Range (IQR) | 14.9% | 12.8% |
| Standard Deviation (Sample) | 10.9% | 9.9% |
| Standard Deviation (Population) | 10.9% | 9.7% |
Similar Demographics by Bachelor's Degree
Demographics Similar to Immigrants from India by Bachelor's Degree
In terms of bachelor's degree, the demographic groups most similar to Immigrants from India are Immigrants from Taiwan (51.2%, a difference of 0.21%), Iranian (51.0%, a difference of 0.63%), Immigrants from Singapore (51.9%, a difference of 1.2%), Okinawan (50.5%, a difference of 1.5%), and Immigrants from Iran (50.3%, a difference of 2.0%).
| Demographics | Rating | Rank | Bachelor's Degree |
| Filipinos | 100.0 /100 | #1 | Exceptional 52.7% |
| Immigrants | Singapore | 100.0 /100 | #2 | Exceptional 51.9% |
| Immigrants | India | 100.0 /100 | #3 | Exceptional 51.3% |
| Immigrants | Taiwan | 100.0 /100 | #4 | Exceptional 51.2% |
| Iranians | 100.0 /100 | #5 | Exceptional 51.0% |
| Okinawans | 100.0 /100 | #6 | Exceptional 50.5% |
| Immigrants | Iran | 100.0 /100 | #7 | Exceptional 50.3% |
| Thais | 100.0 /100 | #8 | Exceptional 50.1% |
| Immigrants | Israel | 100.0 /100 | #9 | Exceptional 50.0% |
| Cypriots | 100.0 /100 | #10 | Exceptional 49.0% |
| Immigrants | Australia | 100.0 /100 | #11 | Exceptional 48.5% |
| Immigrants | China | 100.0 /100 | #12 | Exceptional 48.4% |
| Immigrants | South Central Asia | 100.0 /100 | #13 | Exceptional 48.3% |
| Immigrants | Hong Kong | 100.0 /100 | #14 | Exceptional 48.2% |
| Immigrants | Eastern Asia | 100.0 /100 | #15 | Exceptional 48.1% |
Demographics Similar to Yakama by Bachelor's Degree
In terms of bachelor's degree, the demographic groups most similar to Yakama are Tohono O'odham (24.4%, a difference of 0.20%), Yuman (24.5%, a difference of 0.27%), Lumbee (24.8%, a difference of 1.2%), Hopi (25.3%, a difference of 3.4%), and Navajo (23.6%, a difference of 3.6%).
| Demographics | Rating | Rank | Bachelor's Degree |
| Mexicans | 0.0 /100 | #333 | Tragic 27.1% |
| Arapaho | 0.0 /100 | #334 | Tragic 26.6% |
| Natives/Alaskans | 0.0 /100 | #335 | Tragic 26.3% |
| Immigrants | Mexico | 0.0 /100 | #336 | Tragic 26.1% |
| Inupiat | 0.0 /100 | #337 | Tragic 25.8% |
| Pueblo | 0.0 /100 | #338 | Tragic 25.5% |
| Hopi | 0.0 /100 | #339 | Tragic 25.3% |
| Lumbee | 0.0 /100 | #340 | Tragic 24.8% |
| Yuman | 0.0 /100 | #341 | Tragic 24.5% |
| Yakama | 0.0 /100 | #342 | Tragic 24.5% |
| Tohono O'odham | 0.0 /100 | #343 | Tragic 24.4% |
| Navajo | 0.0 /100 | #344 | Tragic 23.6% |
| Pima | 0.0 /100 | #345 | Tragic 23.2% |
| Houma | 0.0 /100 | #346 | Tragic 21.4% |
| Yup'ik | 0.0 /100 | #347 | Tragic 19.4% |