Immigrants from Armenia vs Crow Associate's Degree
COMPARE
Immigrants from Armenia
Crow
Associate's Degree
Associate's Degree Comparison
Immigrants from Armenia
Crow
47.4%
ASSOCIATE'S DEGREE
76.6/ 100
METRIC RATING
149th/ 347
METRIC RANK
37.6%
ASSOCIATE'S DEGREE
0.0/ 100
METRIC RATING
316th/ 347
METRIC RANK
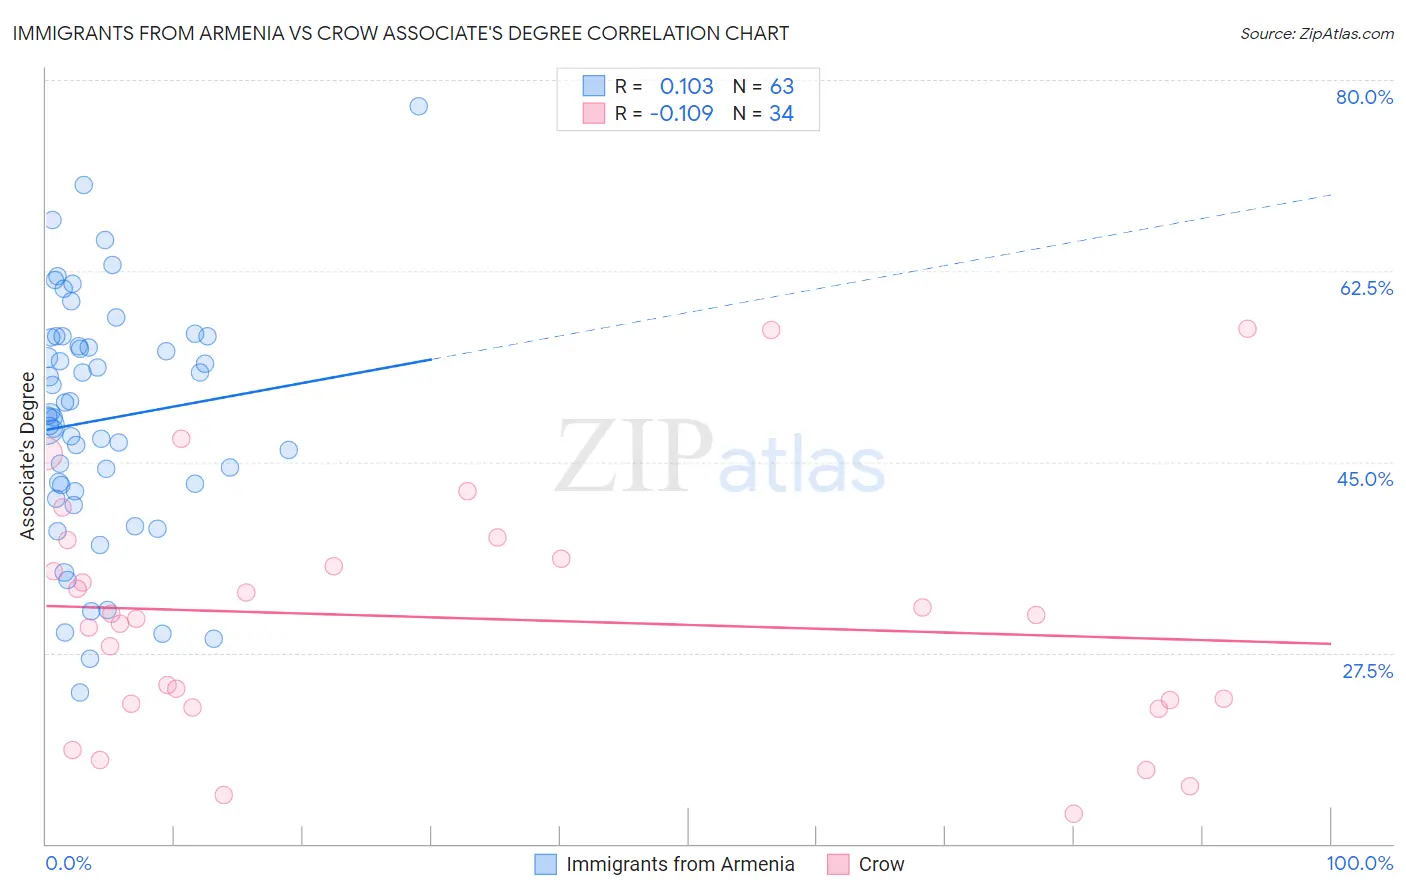
Immigrants from Armenia vs Crow Associate's Degree Correlation Chart
The statistical analysis conducted on geographies consisting of 97,722,982 people shows a poor positive correlation between the proportion of Immigrants from Armenia and percentage of population with at least associate's degree education in the United States with a correlation coefficient (R) of 0.103 and weighted average of 47.4%. Similarly, the statistical analysis conducted on geographies consisting of 59,209,492 people shows a poor negative correlation between the proportion of Crow and percentage of population with at least associate's degree education in the United States with a correlation coefficient (R) of -0.109 and weighted average of 37.6%, a difference of 26.2%.
Associate's Degree Correlation Summary
| Measurement | Immigrants from Armenia | Crow |
| Minimum | 23.8% | 12.8% |
| Maximum | 77.6% | 57.2% |
| Range | 53.7% | 44.4% |
| Mean | 48.9% | 30.7% |
| Median | 49.2% | 30.8% |
| Interquartile 25% (IQ1) | 42.3% | 22.8% |
| Interquartile 75% (IQ3) | 56.4% | 36.1% |
| Interquartile Range (IQR) | 14.1% | 13.3% |
| Standard Deviation (Sample) | 11.1% | 11.1% |
| Standard Deviation (Population) | 11.0% | 10.9% |
Similar Demographics by Associate's Degree
Demographics Similar to Immigrants from Armenia by Associate's Degree
In terms of associate's degree, the demographic groups most similar to Immigrants from Armenia are South American Indian (47.4%, a difference of 0.010%), Iraqi (47.4%, a difference of 0.040%), Immigrants from North Macedonia (47.4%, a difference of 0.060%), Danish (47.4%, a difference of 0.070%), and Immigrants from Sudan (47.4%, a difference of 0.13%).
| Demographics | Rating | Rank | Associate's Degree |
| Sierra Leoneans | 82.9 /100 | #142 | Excellent 47.7% |
| Norwegians | 81.0 /100 | #143 | Excellent 47.6% |
| Slavs | 80.5 /100 | #144 | Excellent 47.6% |
| Canadians | 79.0 /100 | #145 | Good 47.5% |
| Immigrants | Sudan | 77.9 /100 | #146 | Good 47.4% |
| Danes | 77.3 /100 | #147 | Good 47.4% |
| South American Indians | 76.7 /100 | #148 | Good 47.4% |
| Immigrants | Armenia | 76.6 /100 | #149 | Good 47.4% |
| Iraqis | 76.2 /100 | #150 | Good 47.4% |
| Immigrants | North Macedonia | 76.0 /100 | #151 | Good 47.4% |
| Immigrants | Afghanistan | 74.3 /100 | #152 | Good 47.3% |
| Czechs | 72.2 /100 | #153 | Good 47.2% |
| Immigrants | Kenya | 72.1 /100 | #154 | Good 47.2% |
| Kenyans | 70.6 /100 | #155 | Good 47.1% |
| South Americans | 70.5 /100 | #156 | Good 47.1% |
Demographics Similar to Crow by Associate's Degree
In terms of associate's degree, the demographic groups most similar to Crow are Creek (37.6%, a difference of 0.010%), Yaqui (37.6%, a difference of 0.020%), Alaska Native (37.5%, a difference of 0.25%), Seminole (37.7%, a difference of 0.40%), and Hispanic or Latino (37.7%, a difference of 0.45%).
| Demographics | Rating | Rank | Associate's Degree |
| Immigrants | Guatemala | 0.0 /100 | #309 | Tragic 38.1% |
| Immigrants | Dominican Republic | 0.0 /100 | #310 | Tragic 37.9% |
| Immigrants | Latin America | 0.0 /100 | #311 | Tragic 37.9% |
| Choctaw | 0.0 /100 | #312 | Tragic 37.8% |
| Hispanics or Latinos | 0.0 /100 | #313 | Tragic 37.7% |
| Seminole | 0.0 /100 | #314 | Tragic 37.7% |
| Creek | 0.0 /100 | #315 | Tragic 37.6% |
| Crow | 0.0 /100 | #316 | Tragic 37.6% |
| Yaqui | 0.0 /100 | #317 | Tragic 37.6% |
| Alaska Natives | 0.0 /100 | #318 | Tragic 37.5% |
| Fijians | 0.0 /100 | #319 | Tragic 37.4% |
| Cajuns | 0.0 /100 | #320 | Tragic 37.4% |
| Immigrants | Yemen | 0.0 /100 | #321 | Tragic 37.3% |
| Pennsylvania Germans | 0.0 /100 | #322 | Tragic 37.2% |
| Immigrants | Cabo Verde | 0.0 /100 | #323 | Tragic 36.8% |