Immigrants from Cabo Verde vs Nonimmigrants Master's Degree
COMPARE
Immigrants from Cabo Verde
Nonimmigrants
Master's Degree
Master's Degree Comparison
Immigrants from Cabo Verde
Nonimmigrants
11.3%
MASTER'S DEGREE
0.1/ 100
METRIC RATING
304th/ 347
METRIC RANK
13.3%
MASTER'S DEGREE
3.4/ 100
METRIC RATING
239th/ 347
METRIC RANK
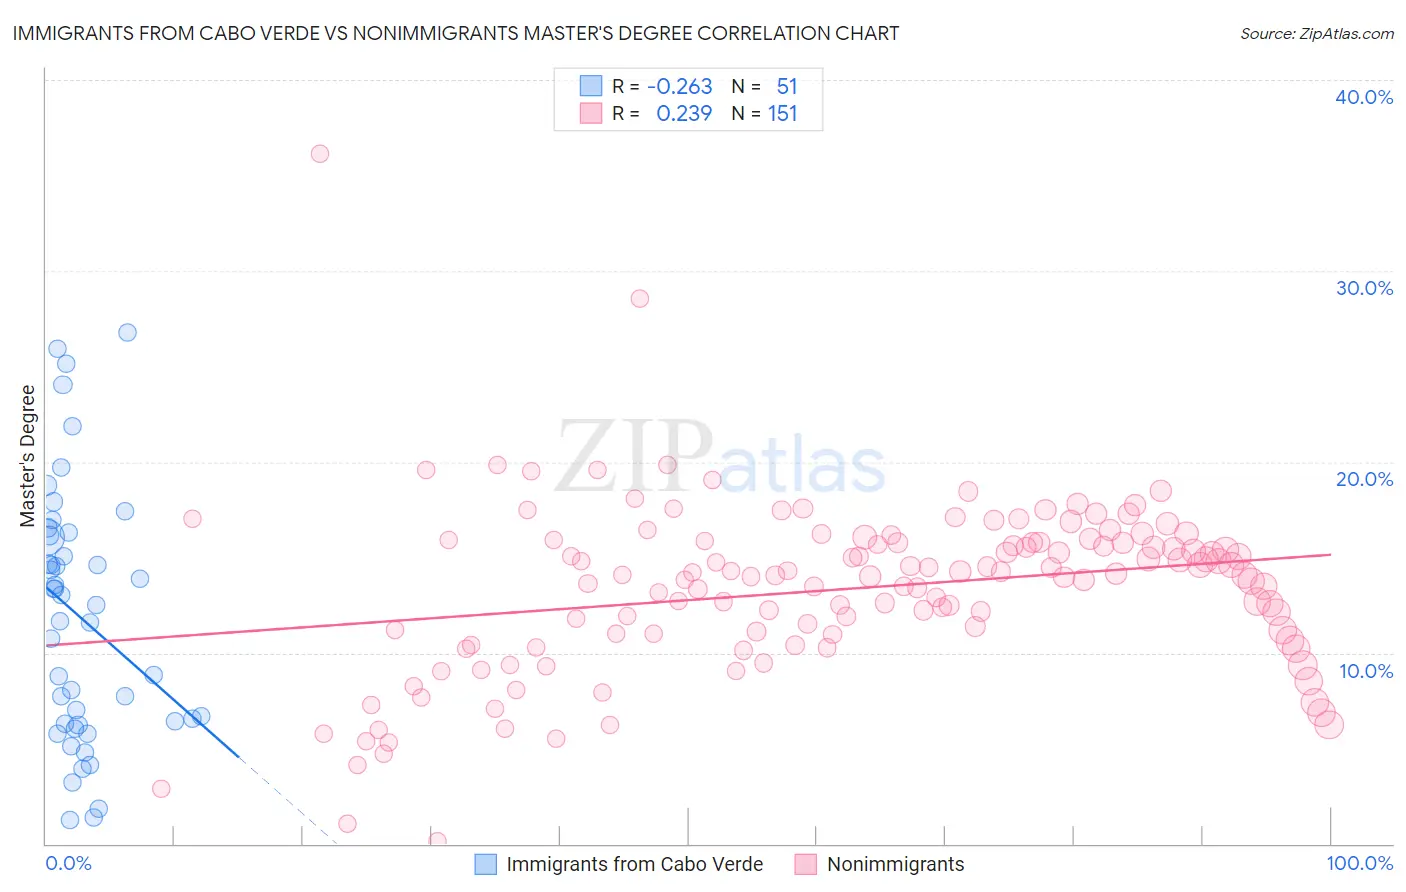
Immigrants from Cabo Verde vs Nonimmigrants Master's Degree Correlation Chart
The statistical analysis conducted on geographies consisting of 38,158,316 people shows a weak negative correlation between the proportion of Immigrants from Cabo Verde and percentage of population with at least master's degree education in the United States with a correlation coefficient (R) of -0.263 and weighted average of 11.3%. Similarly, the statistical analysis conducted on geographies consisting of 583,073,309 people shows a weak positive correlation between the proportion of Nonimmigrants and percentage of population with at least master's degree education in the United States with a correlation coefficient (R) of 0.239 and weighted average of 13.3%, a difference of 17.5%.
Master's Degree Correlation Summary
| Measurement | Immigrants from Cabo Verde | Nonimmigrants |
| Minimum | 1.2% | 0.15% |
| Maximum | 26.8% | 36.1% |
| Range | 25.5% | 36.0% |
| Mean | 11.9% | 13.3% |
| Median | 12.5% | 14.1% |
| Interquartile 25% (IQ1) | 6.3% | 11.0% |
| Interquartile 75% (IQ3) | 16.1% | 15.8% |
| Interquartile Range (IQR) | 9.8% | 4.8% |
| Standard Deviation (Sample) | 6.6% | 4.5% |
| Standard Deviation (Population) | 6.5% | 4.5% |
Similar Demographics by Master's Degree
Demographics Similar to Immigrants from Cabo Verde by Master's Degree
In terms of master's degree, the demographic groups most similar to Immigrants from Cabo Verde are Immigrants from Laos (11.4%, a difference of 0.19%), Cherokee (11.4%, a difference of 0.21%), Tsimshian (11.4%, a difference of 0.52%), Immigrants from Latin America (11.3%, a difference of 0.65%), and Chippewa (11.4%, a difference of 0.68%).
| Demographics | Rating | Rank | Master's Degree |
| Immigrants | Yemen | 0.1 /100 | #297 | Tragic 11.6% |
| Samoans | 0.1 /100 | #298 | Tragic 11.5% |
| Chickasaw | 0.1 /100 | #299 | Tragic 11.4% |
| Chippewa | 0.1 /100 | #300 | Tragic 11.4% |
| Tsimshian | 0.1 /100 | #301 | Tragic 11.4% |
| Cherokee | 0.1 /100 | #302 | Tragic 11.4% |
| Immigrants | Laos | 0.1 /100 | #303 | Tragic 11.4% |
| Immigrants | Cabo Verde | 0.1 /100 | #304 | Tragic 11.3% |
| Immigrants | Latin America | 0.0 /100 | #305 | Tragic 11.3% |
| Mexican American Indians | 0.0 /100 | #306 | Tragic 11.2% |
| Cheyenne | 0.0 /100 | #307 | Tragic 11.2% |
| Puerto Ricans | 0.0 /100 | #308 | Tragic 11.2% |
| Puget Sound Salish | 0.0 /100 | #309 | Tragic 11.1% |
| Shoshone | 0.0 /100 | #310 | Tragic 11.1% |
| Seminole | 0.0 /100 | #311 | Tragic 11.0% |
Demographics Similar to Nonimmigrants by Master's Degree
In terms of master's degree, the demographic groups most similar to Nonimmigrants are Hmong (13.4%, a difference of 0.53%), Jamaican (13.4%, a difference of 0.67%), Immigrants from Guyana (13.4%, a difference of 0.89%), German Russian (13.5%, a difference of 1.0%), and Immigrants from Burma/Myanmar (13.5%, a difference of 1.4%).
| Demographics | Rating | Rank | Master's Degree |
| Immigrants | Philippines | 6.0 /100 | #232 | Tragic 13.6% |
| Immigrants | Ecuador | 5.7 /100 | #233 | Tragic 13.6% |
| Immigrants | Burma/Myanmar | 5.0 /100 | #234 | Tragic 13.5% |
| German Russians | 4.5 /100 | #235 | Tragic 13.5% |
| Immigrants | Guyana | 4.4 /100 | #236 | Tragic 13.4% |
| Jamaicans | 4.1 /100 | #237 | Tragic 13.4% |
| Hmong | 4.0 /100 | #238 | Tragic 13.4% |
| Immigrants | Nonimmigrants | 3.4 /100 | #239 | Tragic 13.3% |
| Guamanians/Chamorros | 2.2 /100 | #240 | Tragic 13.1% |
| U.S. Virgin Islanders | 2.1 /100 | #241 | Tragic 13.1% |
| Spanish Americans | 1.9 /100 | #242 | Tragic 13.0% |
| Immigrants | Jamaica | 1.9 /100 | #243 | Tragic 13.0% |
| Delaware | 1.7 /100 | #244 | Tragic 13.0% |
| Immigrants | Bahamas | 1.4 /100 | #245 | Tragic 12.9% |
| Immigrants | Cambodia | 1.4 /100 | #246 | Tragic 12.9% |