Trinidadian and Tobagonian vs Nonimmigrants 7th Grade
COMPARE
Trinidadian and Tobagonian
Nonimmigrants
7th Grade
7th Grade Comparison
Trinidadians and Tobagonians
Nonimmigrants
95.2%
7TH GRADE
0.3/ 100
METRIC RATING
269th/ 347
METRIC RANK
96.5%
7TH GRADE
97.0/ 100
METRIC RATING
112th/ 347
METRIC RANK
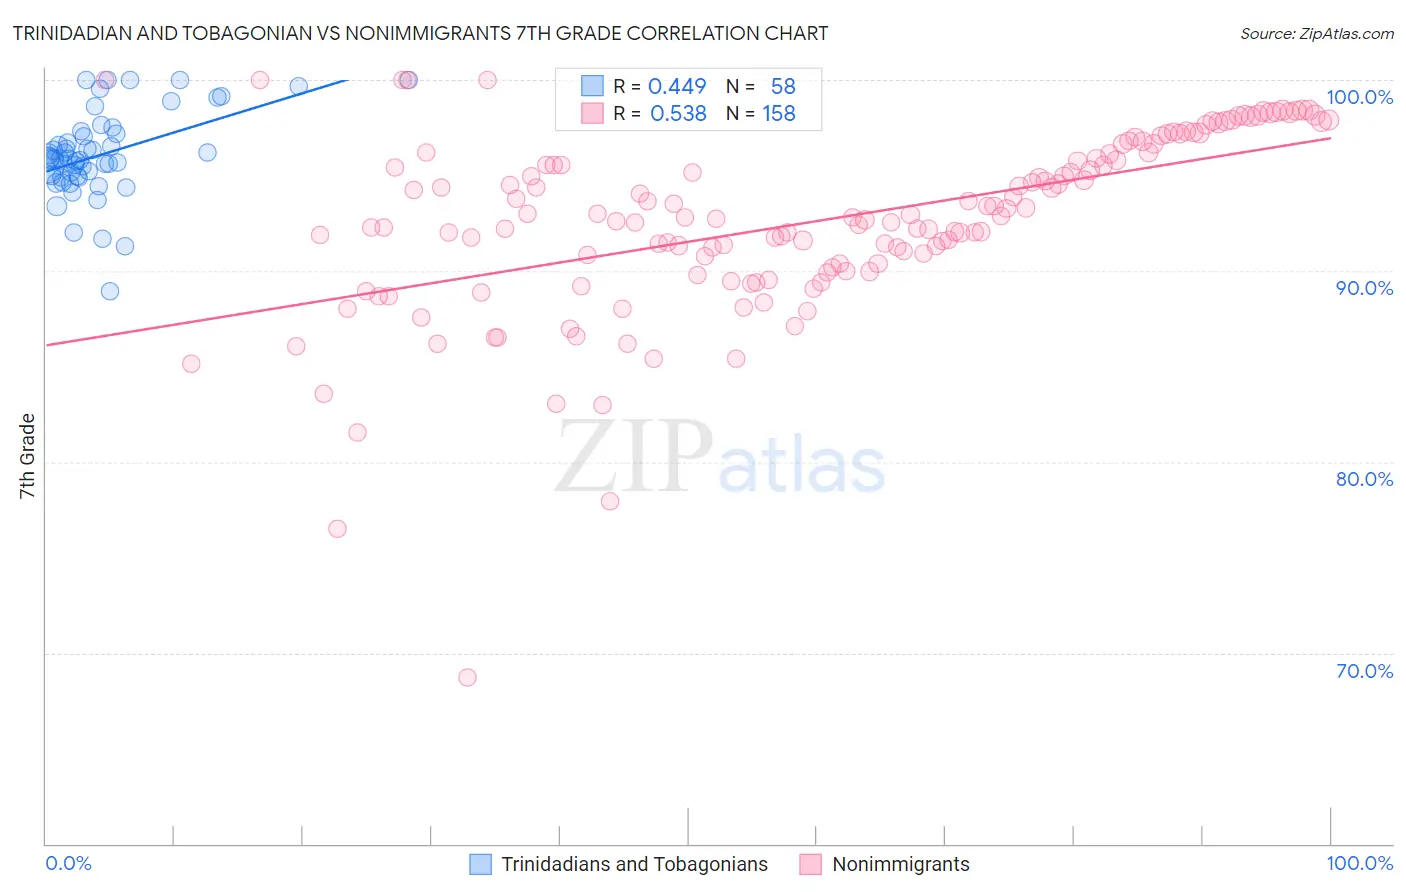
Trinidadian and Tobagonian vs Nonimmigrants 7th Grade Correlation Chart
The statistical analysis conducted on geographies consisting of 219,881,170 people shows a moderate positive correlation between the proportion of Trinidadians and Tobagonians and percentage of population with at least 7th grade education in the United States with a correlation coefficient (R) of 0.449 and weighted average of 95.2%. Similarly, the statistical analysis conducted on geographies consisting of 585,374,406 people shows a substantial positive correlation between the proportion of Nonimmigrants and percentage of population with at least 7th grade education in the United States with a correlation coefficient (R) of 0.538 and weighted average of 96.5%, a difference of 1.5%.
7th Grade Correlation Summary
| Measurement | Trinidadian and Tobagonian | Nonimmigrants |
| Minimum | 89.0% | 68.7% |
| Maximum | 100.0% | 100.0% |
| Range | 11.0% | 31.3% |
| Mean | 96.1% | 92.6% |
| Median | 95.9% | 92.8% |
| Interquartile 25% (IQ1) | 95.0% | 90.2% |
| Interquartile 75% (IQ3) | 97.2% | 96.1% |
| Interquartile Range (IQR) | 2.2% | 5.9% |
| Standard Deviation (Sample) | 2.3% | 4.7% |
| Standard Deviation (Population) | 2.2% | 4.7% |
Similar Demographics by 7th Grade
Demographics Similar to Trinidadians and Tobagonians by 7th Grade
In terms of 7th grade, the demographic groups most similar to Trinidadians and Tobagonians are Immigrants from Hong Kong (95.2%, a difference of 0.020%), Houma (95.1%, a difference of 0.020%), Immigrants from South America (95.1%, a difference of 0.020%), Peruvian (95.1%, a difference of 0.020%), and Immigrants from Uzbekistan (95.1%, a difference of 0.020%).
| Demographics | Rating | Rank | 7th Grade |
| Immigrants | Somalia | 0.5 /100 | #262 | Tragic 95.2% |
| West Indians | 0.5 /100 | #263 | Tragic 95.2% |
| Immigrants | Nigeria | 0.4 /100 | #264 | Tragic 95.2% |
| Immigrants | Uruguay | 0.3 /100 | #265 | Tragic 95.2% |
| Immigrants | Ghana | 0.3 /100 | #266 | Tragic 95.2% |
| Yuman | 0.3 /100 | #267 | Tragic 95.2% |
| Immigrants | Hong Kong | 0.3 /100 | #268 | Tragic 95.2% |
| Trinidadians and Tobagonians | 0.3 /100 | #269 | Tragic 95.2% |
| Houma | 0.2 /100 | #270 | Tragic 95.1% |
| Immigrants | South America | 0.2 /100 | #271 | Tragic 95.1% |
| Peruvians | 0.2 /100 | #272 | Tragic 95.1% |
| Immigrants | Uzbekistan | 0.2 /100 | #273 | Tragic 95.1% |
| Immigrants | Western Africa | 0.2 /100 | #274 | Tragic 95.1% |
| Immigrants | Colombia | 0.2 /100 | #275 | Tragic 95.1% |
| Immigrants | Thailand | 0.2 /100 | #276 | Tragic 95.1% |
Demographics Similar to Nonimmigrants by 7th Grade
In terms of 7th grade, the demographic groups most similar to Nonimmigrants are Pueblo (96.5%, a difference of 0.010%), Okinawan (96.6%, a difference of 0.020%), Immigrants from Latvia (96.6%, a difference of 0.020%), Immigrants from Zimbabwe (96.5%, a difference of 0.020%), and Choctaw (96.5%, a difference of 0.020%).
| Demographics | Rating | Rank | 7th Grade |
| South Africans | 98.0 /100 | #105 | Exceptional 96.6% |
| Iroquois | 97.9 /100 | #106 | Exceptional 96.6% |
| Lumbee | 97.8 /100 | #107 | Exceptional 96.6% |
| Immigrants | Saudi Arabia | 97.8 /100 | #108 | Exceptional 96.6% |
| Bhutanese | 97.7 /100 | #109 | Exceptional 96.6% |
| Okinawans | 97.4 /100 | #110 | Exceptional 96.6% |
| Immigrants | Latvia | 97.4 /100 | #111 | Exceptional 96.6% |
| Immigrants | Nonimmigrants | 97.0 /100 | #112 | Exceptional 96.5% |
| Pueblo | 96.8 /100 | #113 | Exceptional 96.5% |
| Immigrants | Zimbabwe | 96.6 /100 | #114 | Exceptional 96.5% |
| Choctaw | 96.6 /100 | #115 | Exceptional 96.5% |
| Syrians | 96.6 /100 | #116 | Exceptional 96.5% |
| Immigrants | Moldova | 95.7 /100 | #117 | Exceptional 96.5% |
| Immigrants | Japan | 95.5 /100 | #118 | Exceptional 96.5% |
| Immigrants | Norway | 95.2 /100 | #119 | Exceptional 96.5% |