Immigrants from Cabo Verde vs Immigrants from Hong Kong No Schooling Completed
COMPARE
Immigrants from Cabo Verde
Immigrants from Hong Kong
No Schooling Completed
No Schooling Completed Comparison
Immigrants from Cabo Verde
Immigrants from Hong Kong
3.5%
NO SCHOOLING COMPLETED
0.0/ 100
METRIC RATING
337th/ 347
METRIC RANK
2.7%
NO SCHOOLING COMPLETED
0.0/ 100
METRIC RATING
290th/ 347
METRIC RANK
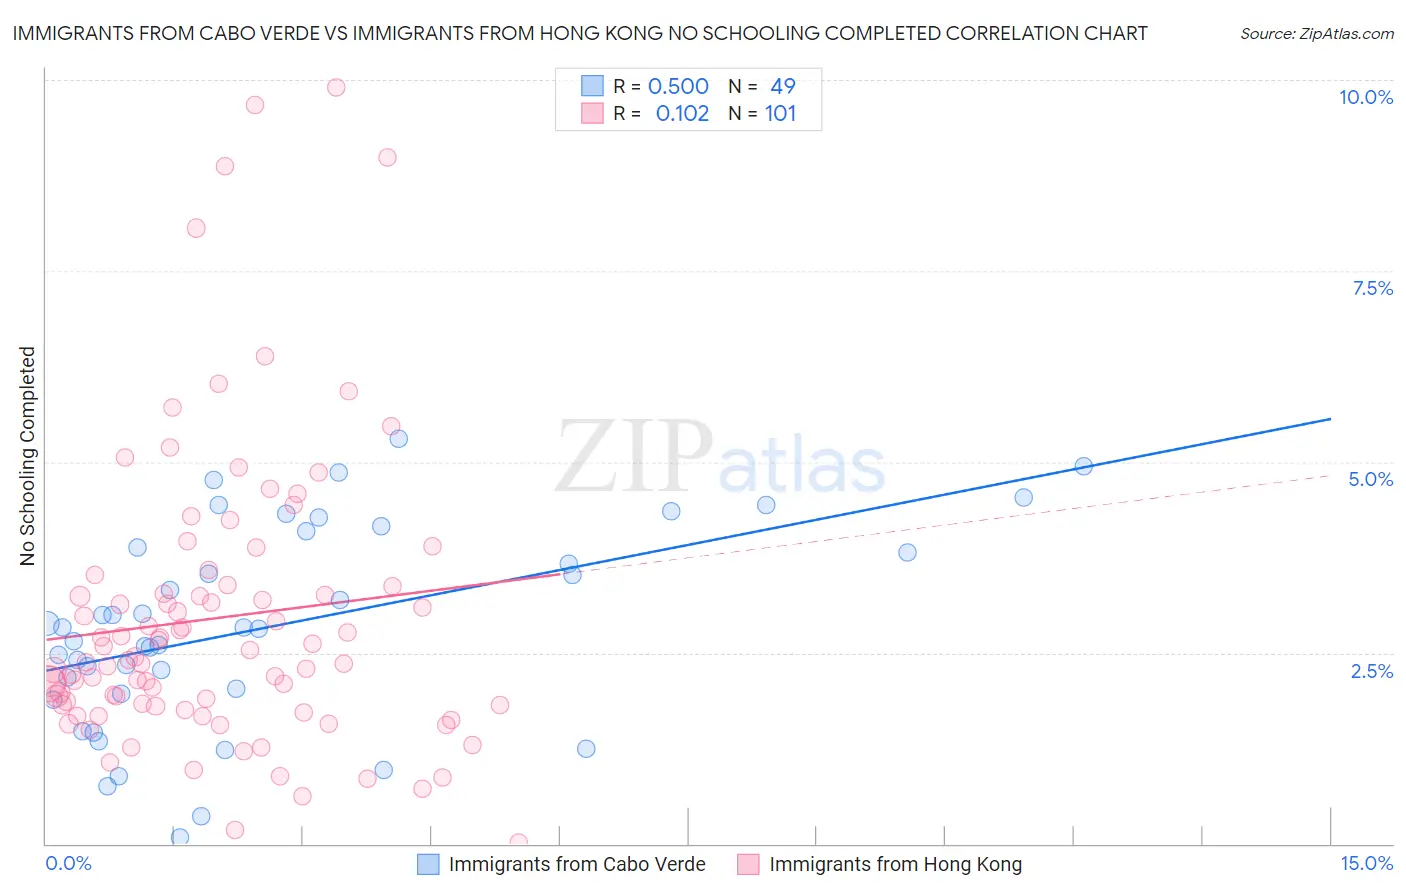
Immigrants from Cabo Verde vs Immigrants from Hong Kong No Schooling Completed Correlation Chart
The statistical analysis conducted on geographies consisting of 38,057,736 people shows a substantial positive correlation between the proportion of Immigrants from Cabo Verde and percentage of population with no schooling in the United States with a correlation coefficient (R) of 0.500 and weighted average of 3.5%. Similarly, the statistical analysis conducted on geographies consisting of 252,436,459 people shows a poor positive correlation between the proportion of Immigrants from Hong Kong and percentage of population with no schooling in the United States with a correlation coefficient (R) of 0.102 and weighted average of 2.7%, a difference of 30.7%.
No Schooling Completed Correlation Summary
| Measurement | Immigrants from Cabo Verde | Immigrants from Hong Kong |
| Minimum | 0.088% | 0.020% |
| Maximum | 5.3% | 9.9% |
| Range | 5.2% | 9.9% |
| Mean | 2.9% | 3.0% |
| Median | 2.8% | 2.4% |
| Interquartile 25% (IQ1) | 2.0% | 1.8% |
| Interquartile 75% (IQ3) | 4.0% | 3.4% |
| Interquartile Range (IQR) | 2.0% | 1.6% |
| Standard Deviation (Sample) | 1.3% | 1.9% |
| Standard Deviation (Population) | 1.3% | 1.9% |
Similar Demographics by No Schooling Completed
Demographics Similar to Immigrants from Cabo Verde by No Schooling Completed
In terms of no schooling completed, the demographic groups most similar to Immigrants from Cabo Verde are Bangladeshi (3.5%, a difference of 0.23%), Yakama (3.6%, a difference of 0.55%), Immigrants from Fiji (3.5%, a difference of 0.71%), Immigrants from Cambodia (3.5%, a difference of 1.1%), and Immigrants from Guatemala (3.6%, a difference of 1.2%).
| Demographics | Rating | Rank | No Schooling Completed |
| Immigrants | Armenia | 0.0 /100 | #330 | Tragic 3.3% |
| Japanese | 0.0 /100 | #331 | Tragic 3.3% |
| Central Americans | 0.0 /100 | #332 | Tragic 3.4% |
| Immigrants | Dominican Republic | 0.0 /100 | #333 | Tragic 3.4% |
| Guatemalans | 0.0 /100 | #334 | Tragic 3.5% |
| Immigrants | Cambodia | 0.0 /100 | #335 | Tragic 3.5% |
| Immigrants | Fiji | 0.0 /100 | #336 | Tragic 3.5% |
| Immigrants | Cabo Verde | 0.0 /100 | #337 | Tragic 3.5% |
| Bangladeshis | 0.0 /100 | #338 | Tragic 3.5% |
| Yakama | 0.0 /100 | #339 | Tragic 3.6% |
| Immigrants | Guatemala | 0.0 /100 | #340 | Tragic 3.6% |
| Immigrants | Central America | 0.0 /100 | #341 | Tragic 3.6% |
| Immigrants | Mexico | 0.0 /100 | #342 | Tragic 3.6% |
| Salvadorans | 0.0 /100 | #343 | Tragic 3.7% |
| Nepalese | 0.0 /100 | #344 | Tragic 3.8% |
Demographics Similar to Immigrants from Hong Kong by No Schooling Completed
In terms of no schooling completed, the demographic groups most similar to Immigrants from Hong Kong are Immigrants from Thailand (2.7%, a difference of 0.060%), Immigrants from St. Vincent and the Grenadines (2.7%, a difference of 0.38%), Immigrants from Afghanistan (2.7%, a difference of 0.48%), British West Indian (2.7%, a difference of 0.89%), and Immigrants from Portugal (2.7%, a difference of 1.3%).
| Demographics | Rating | Rank | No Schooling Completed |
| Immigrants | Trinidad and Tobago | 0.0 /100 | #283 | Tragic 2.6% |
| Immigrants | West Indies | 0.0 /100 | #284 | Tragic 2.7% |
| Immigrants | Barbados | 0.0 /100 | #285 | Tragic 2.7% |
| Immigrants | Portugal | 0.0 /100 | #286 | Tragic 2.7% |
| Immigrants | Afghanistan | 0.0 /100 | #287 | Tragic 2.7% |
| Immigrants | St. Vincent and the Grenadines | 0.0 /100 | #288 | Tragic 2.7% |
| Immigrants | Thailand | 0.0 /100 | #289 | Tragic 2.7% |
| Immigrants | Hong Kong | 0.0 /100 | #290 | Tragic 2.7% |
| British West Indians | 0.0 /100 | #291 | Tragic 2.7% |
| Immigrants | Grenada | 0.0 /100 | #292 | Tragic 2.8% |
| Malaysians | 0.0 /100 | #293 | Tragic 2.8% |
| Immigrants | Eritrea | 0.0 /100 | #294 | Tragic 2.8% |
| Houma | 0.0 /100 | #295 | Tragic 2.8% |
| Immigrants | Immigrants | 0.0 /100 | #296 | Tragic 2.8% |
| Immigrants | Cuba | 0.0 /100 | #297 | Tragic 2.8% |