Immigrants from Peru vs Immigrants from Egypt 7th Grade
COMPARE
Immigrants from Peru
Immigrants from Egypt
7th Grade
7th Grade Comparison
Immigrants from Peru
Immigrants from Egypt
94.9%
7TH GRADE
0.0/ 100
METRIC RATING
287th/ 347
METRIC RANK
95.9%
7TH GRADE
34.3/ 100
METRIC RATING
188th/ 347
METRIC RANK
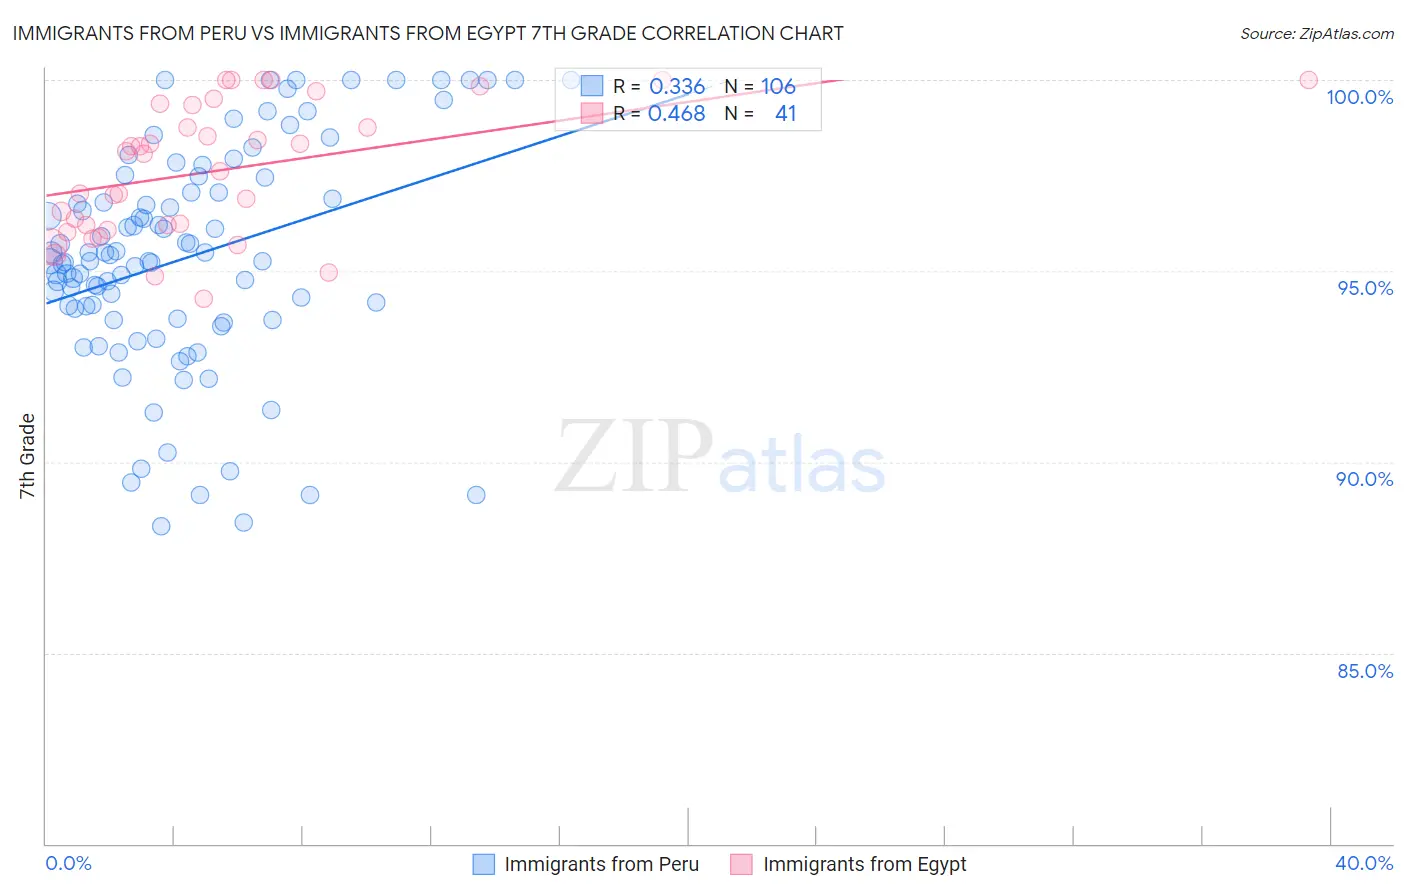
Immigrants from Peru vs Immigrants from Egypt 7th Grade Correlation Chart
The statistical analysis conducted on geographies consisting of 328,685,851 people shows a mild positive correlation between the proportion of Immigrants from Peru and percentage of population with at least 7th grade education in the United States with a correlation coefficient (R) of 0.336 and weighted average of 94.9%. Similarly, the statistical analysis conducted on geographies consisting of 245,485,794 people shows a moderate positive correlation between the proportion of Immigrants from Egypt and percentage of population with at least 7th grade education in the United States with a correlation coefficient (R) of 0.468 and weighted average of 95.9%, a difference of 1.1%.
7th Grade Correlation Summary
| Measurement | Immigrants from Peru | Immigrants from Egypt |
| Minimum | 88.3% | 94.3% |
| Maximum | 100.0% | 100.0% |
| Range | 11.7% | 5.7% |
| Mean | 95.4% | 97.6% |
| Median | 95.3% | 98.1% |
| Interquartile 25% (IQ1) | 93.7% | 96.1% |
| Interquartile 75% (IQ3) | 97.1% | 99.4% |
| Interquartile Range (IQR) | 3.3% | 3.2% |
| Standard Deviation (Sample) | 2.9% | 1.7% |
| Standard Deviation (Population) | 2.9% | 1.7% |
Similar Demographics by 7th Grade
Demographics Similar to Immigrants from Peru by 7th Grade
In terms of 7th grade, the demographic groups most similar to Immigrants from Peru are Immigrants from Philippines (94.9%, a difference of 0.010%), British West Indian (94.8%, a difference of 0.020%), Taiwanese (94.8%, a difference of 0.030%), Malaysian (94.8%, a difference of 0.050%), and Armenian (95.0%, a difference of 0.090%).
| Demographics | Rating | Rank | 7th Grade |
| Immigrants | St. Vincent and the Grenadines | 0.1 /100 | #280 | Tragic 95.0% |
| Tohono O'odham | 0.1 /100 | #281 | Tragic 95.0% |
| Immigrants | Bolivia | 0.1 /100 | #282 | Tragic 95.0% |
| Immigrants | Barbados | 0.1 /100 | #283 | Tragic 95.0% |
| Armenians | 0.1 /100 | #284 | Tragic 95.0% |
| Immigrants | Eritrea | 0.1 /100 | #285 | Tragic 94.9% |
| Immigrants | Philippines | 0.0 /100 | #286 | Tragic 94.9% |
| Immigrants | Peru | 0.0 /100 | #287 | Tragic 94.9% |
| British West Indians | 0.0 /100 | #288 | Tragic 94.8% |
| Taiwanese | 0.0 /100 | #289 | Tragic 94.8% |
| Malaysians | 0.0 /100 | #290 | Tragic 94.8% |
| Immigrants | Grenada | 0.0 /100 | #291 | Tragic 94.8% |
| Immigrants | West Indies | 0.0 /100 | #292 | Tragic 94.8% |
| Fijians | 0.0 /100 | #293 | Tragic 94.7% |
| Haitians | 0.0 /100 | #294 | Tragic 94.7% |
Demographics Similar to Immigrants from Egypt by 7th Grade
In terms of 7th grade, the demographic groups most similar to Immigrants from Egypt are Immigrants from Venezuela (95.9%, a difference of 0.0%), Immigrants from Iraq (96.0%, a difference of 0.010%), Immigrants from Uganda (96.0%, a difference of 0.010%), Immigrants from Micronesia (95.9%, a difference of 0.010%), and Liberian (95.9%, a difference of 0.010%).
| Demographics | Rating | Rank | 7th Grade |
| Pakistanis | 44.5 /100 | #181 | Average 96.0% |
| Iraqis | 41.2 /100 | #182 | Average 96.0% |
| Immigrants | Spain | 38.8 /100 | #183 | Fair 96.0% |
| Sierra Leoneans | 37.5 /100 | #184 | Fair 96.0% |
| Brazilians | 37.3 /100 | #185 | Fair 96.0% |
| Immigrants | Iraq | 36.1 /100 | #186 | Fair 96.0% |
| Immigrants | Uganda | 36.0 /100 | #187 | Fair 96.0% |
| Immigrants | Egypt | 34.3 /100 | #188 | Fair 95.9% |
| Immigrants | Venezuela | 33.9 /100 | #189 | Fair 95.9% |
| Immigrants | Micronesia | 32.6 /100 | #190 | Fair 95.9% |
| Liberians | 32.5 /100 | #191 | Fair 95.9% |
| Panamanians | 32.3 /100 | #192 | Fair 95.9% |
| Immigrants | Bahamas | 30.8 /100 | #193 | Fair 95.9% |
| Immigrants | Nepal | 30.0 /100 | #194 | Fair 95.9% |
| Sudanese | 28.1 /100 | #195 | Fair 95.9% |