Immigrants from Bosnia and Herzegovina vs Immigrants from Northern Europe Doctorate Degree
COMPARE
Immigrants from Bosnia and Herzegovina
Immigrants from Northern Europe
Doctorate Degree
Doctorate Degree Comparison
Immigrants from Bosnia and Herzegovina
Immigrants from Northern Europe
1.7%
DOCTORATE DEGREE
7.8/ 100
METRIC RATING
223rd/ 347
METRIC RANK
2.6%
DOCTORATE DEGREE
100.0/ 100
METRIC RATING
32nd/ 347
METRIC RANK
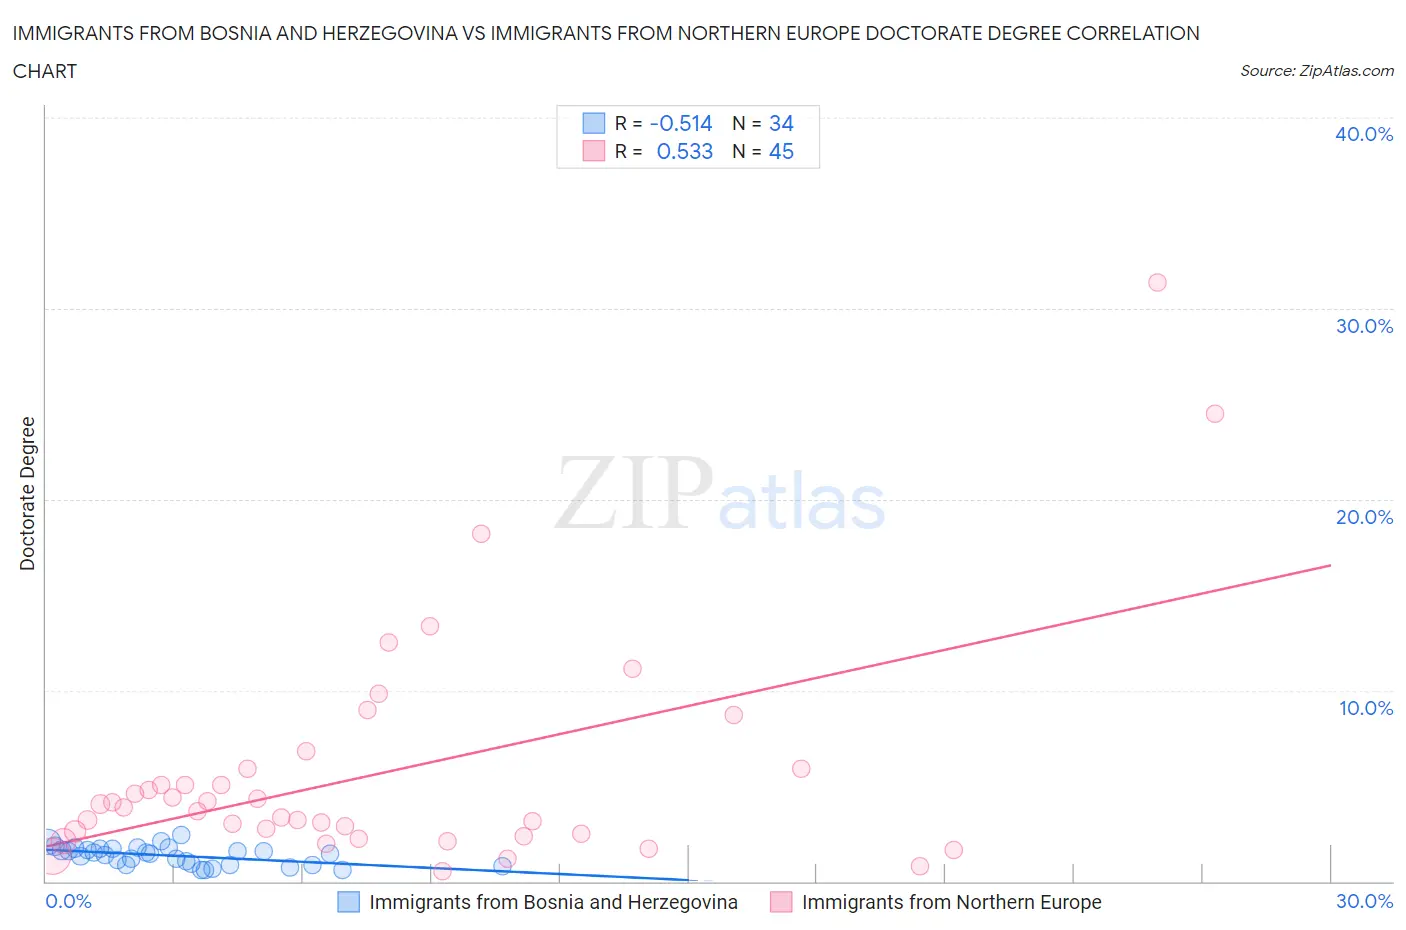
Immigrants from Bosnia and Herzegovina vs Immigrants from Northern Europe Doctorate Degree Correlation Chart
The statistical analysis conducted on geographies consisting of 156,366,031 people shows a substantial negative correlation between the proportion of Immigrants from Bosnia and Herzegovina and percentage of population with at least doctorate degree education in the United States with a correlation coefficient (R) of -0.514 and weighted average of 1.7%. Similarly, the statistical analysis conducted on geographies consisting of 470,866,361 people shows a substantial positive correlation between the proportion of Immigrants from Northern Europe and percentage of population with at least doctorate degree education in the United States with a correlation coefficient (R) of 0.533 and weighted average of 2.6%, a difference of 53.8%.
Doctorate Degree Correlation Summary
| Measurement | Immigrants from Bosnia and Herzegovina | Immigrants from Northern Europe |
| Minimum | 0.59% | 0.53% |
| Maximum | 2.4% | 31.4% |
| Range | 1.8% | 30.8% |
| Mean | 1.3% | 5.7% |
| Median | 1.4% | 3.9% |
| Interquartile 25% (IQ1) | 0.86% | 2.4% |
| Interquartile 75% (IQ3) | 1.7% | 5.9% |
| Interquartile Range (IQR) | 0.81% | 3.4% |
| Standard Deviation (Sample) | 0.48% | 6.1% |
| Standard Deviation (Population) | 0.47% | 6.0% |
Similar Demographics by Doctorate Degree
Demographics Similar to Immigrants from Bosnia and Herzegovina by Doctorate Degree
In terms of doctorate degree, the demographic groups most similar to Immigrants from Bosnia and Herzegovina are Immigrants from Poland (1.7%, a difference of 0.22%), Immigrants from Venezuela (1.7%, a difference of 0.46%), Nonimmigrants (1.7%, a difference of 0.53%), Immigrants from Colombia (1.7%, a difference of 0.71%), and Immigrants from Uruguay (1.7%, a difference of 0.72%).
| Demographics | Rating | Rank | Doctorate Degree |
| Immigrants | Burma/Myanmar | 13.5 /100 | #216 | Poor 1.7% |
| Spanish Americans | 12.9 /100 | #217 | Poor 1.7% |
| Tlingit-Haida | 11.9 /100 | #218 | Poor 1.7% |
| Immigrants | Iraq | 10.7 /100 | #219 | Poor 1.7% |
| Immigrants | Uruguay | 9.2 /100 | #220 | Tragic 1.7% |
| Immigrants | Nonimmigrants | 8.8 /100 | #221 | Tragic 1.7% |
| Immigrants | Venezuela | 8.7 /100 | #222 | Tragic 1.7% |
| Immigrants | Bosnia and Herzegovina | 7.8 /100 | #223 | Tragic 1.7% |
| Immigrants | Poland | 7.4 /100 | #224 | Tragic 1.7% |
| Immigrants | Colombia | 6.7 /100 | #225 | Tragic 1.7% |
| Osage | 6.5 /100 | #226 | Tragic 1.7% |
| Panamanians | 6.3 /100 | #227 | Tragic 1.7% |
| Assyrians/Chaldeans/Syriacs | 5.9 /100 | #228 | Tragic 1.7% |
| Colville | 4.7 /100 | #229 | Tragic 1.6% |
| Immigrants | Philippines | 4.3 /100 | #230 | Tragic 1.6% |
Demographics Similar to Immigrants from Northern Europe by Doctorate Degree
In terms of doctorate degree, the demographic groups most similar to Immigrants from Northern Europe are Latvian (2.6%, a difference of 0.15%), Cambodian (2.6%, a difference of 0.17%), Cypriot (2.6%, a difference of 0.29%), Immigrants from Malaysia (2.6%, a difference of 0.35%), and Immigrants from Spain (2.6%, a difference of 0.41%).
| Demographics | Rating | Rank | Doctorate Degree |
| Immigrants | Saudi Arabia | 100.0 /100 | #25 | Exceptional 2.7% |
| Turks | 100.0 /100 | #26 | Exceptional 2.7% |
| Immigrants | Turkey | 100.0 /100 | #27 | Exceptional 2.6% |
| Burmese | 100.0 /100 | #28 | Exceptional 2.6% |
| Immigrants | South Central Asia | 100.0 /100 | #29 | Exceptional 2.6% |
| Immigrants | Korea | 100.0 /100 | #30 | Exceptional 2.6% |
| Latvians | 100.0 /100 | #31 | Exceptional 2.6% |
| Immigrants | Northern Europe | 100.0 /100 | #32 | Exceptional 2.6% |
| Cambodians | 100.0 /100 | #33 | Exceptional 2.6% |
| Cypriots | 100.0 /100 | #34 | Exceptional 2.6% |
| Immigrants | Malaysia | 100.0 /100 | #35 | Exceptional 2.6% |
| Immigrants | Spain | 100.0 /100 | #36 | Exceptional 2.6% |
| Immigrants | Kuwait | 100.0 /100 | #37 | Exceptional 2.6% |
| Russians | 100.0 /100 | #38 | Exceptional 2.6% |
| Immigrants | Ireland | 100.0 /100 | #39 | Exceptional 2.5% |