Immigrants from Belgium vs Immigrants from Northern Europe Doctorate Degree
COMPARE
Immigrants from Belgium
Immigrants from Northern Europe
Doctorate Degree
Doctorate Degree Comparison
Immigrants from Belgium
Immigrants from Northern Europe
2.9%
DOCTORATE DEGREE
100.0/ 100
METRIC RATING
12th/ 347
METRIC RANK
2.6%
DOCTORATE DEGREE
100.0/ 100
METRIC RATING
32nd/ 347
METRIC RANK
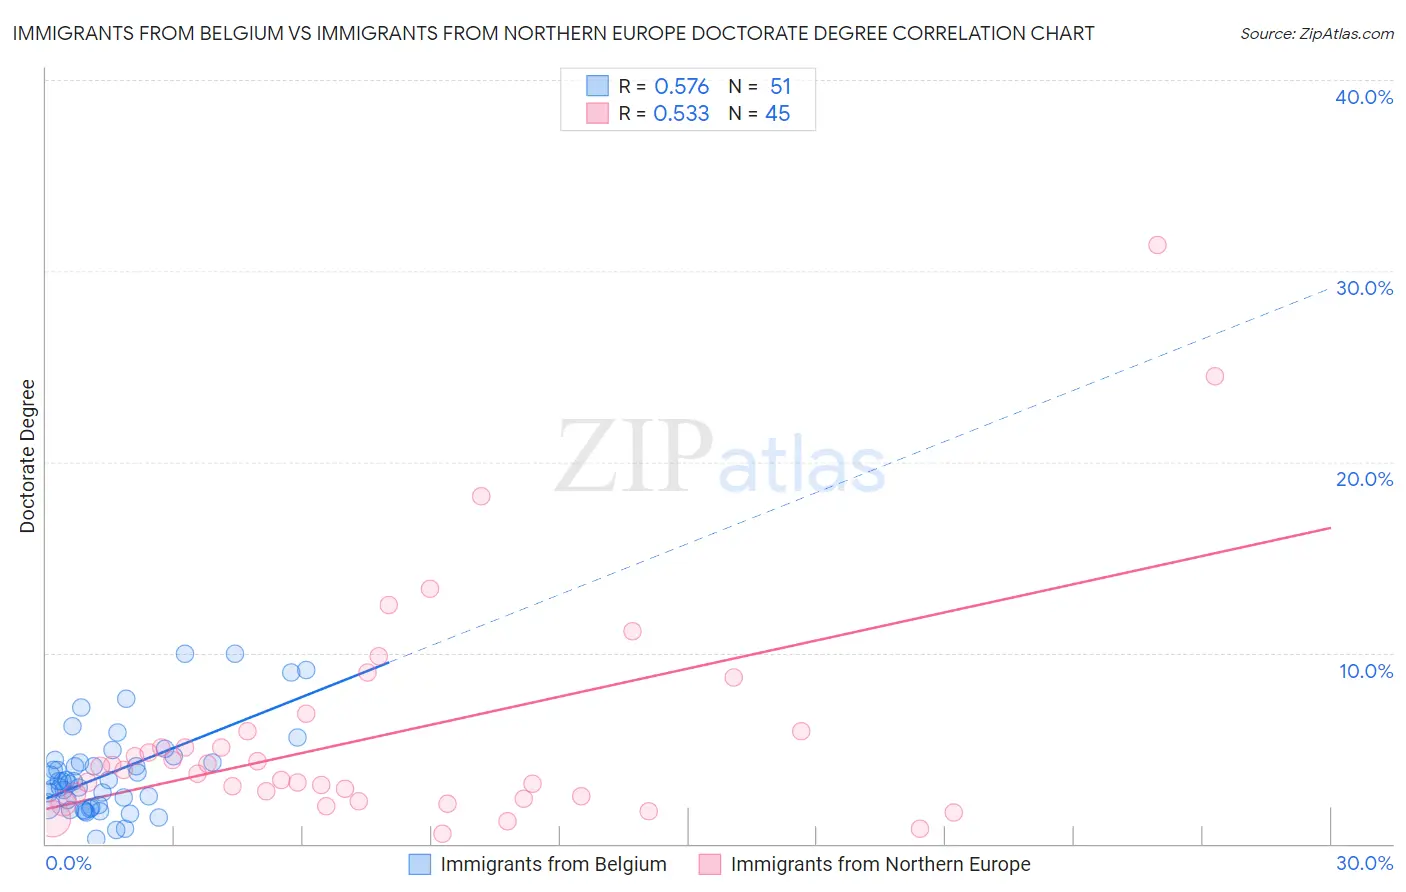
Immigrants from Belgium vs Immigrants from Northern Europe Doctorate Degree Correlation Chart
The statistical analysis conducted on geographies consisting of 146,436,412 people shows a substantial positive correlation between the proportion of Immigrants from Belgium and percentage of population with at least doctorate degree education in the United States with a correlation coefficient (R) of 0.576 and weighted average of 2.9%. Similarly, the statistical analysis conducted on geographies consisting of 470,866,361 people shows a substantial positive correlation between the proportion of Immigrants from Northern Europe and percentage of population with at least doctorate degree education in the United States with a correlation coefficient (R) of 0.533 and weighted average of 2.6%, a difference of 12.4%.
Doctorate Degree Correlation Summary
| Measurement | Immigrants from Belgium | Immigrants from Northern Europe |
| Minimum | 0.23% | 0.53% |
| Maximum | 10.0% | 31.4% |
| Range | 9.7% | 30.8% |
| Mean | 3.7% | 5.7% |
| Median | 3.3% | 3.9% |
| Interquartile 25% (IQ1) | 2.0% | 2.4% |
| Interquartile 75% (IQ3) | 4.4% | 5.9% |
| Interquartile Range (IQR) | 2.4% | 3.4% |
| Standard Deviation (Sample) | 2.3% | 6.1% |
| Standard Deviation (Population) | 2.3% | 6.0% |
Demographics Similar to Immigrants from Belgium and Immigrants from Northern Europe by Doctorate Degree
In terms of doctorate degree, the demographic groups most similar to Immigrants from Belgium are Immigrants from Sweden (2.9%, a difference of 0.94%), Immigrants from France (2.9%, a difference of 0.99%), Immigrants from India (2.8%, a difference of 2.1%), Eastern European (2.8%, a difference of 2.5%), and Immigrants from Australia (2.8%, a difference of 3.2%). Similarly, the demographic groups most similar to Immigrants from Northern Europe are Latvian (2.6%, a difference of 0.15%), Immigrants from Korea (2.6%, a difference of 2.1%), Immigrants from South Central Asia (2.6%, a difference of 2.2%), Burmese (2.6%, a difference of 2.5%), and Immigrants from Turkey (2.6%, a difference of 2.8%).
| Demographics | Rating | Rank | Doctorate Degree |
| Immigrants | Belgium | 100.0 /100 | #12 | Exceptional 2.9% |
| Immigrants | Sweden | 100.0 /100 | #13 | Exceptional 2.9% |
| Immigrants | France | 100.0 /100 | #14 | Exceptional 2.9% |
| Immigrants | India | 100.0 /100 | #15 | Exceptional 2.8% |
| Eastern Europeans | 100.0 /100 | #16 | Exceptional 2.8% |
| Immigrants | Australia | 100.0 /100 | #17 | Exceptional 2.8% |
| Immigrants | Sri Lanka | 100.0 /100 | #18 | Exceptional 2.8% |
| Immigrants | Japan | 100.0 /100 | #19 | Exceptional 2.8% |
| Immigrants | Hong Kong | 100.0 /100 | #20 | Exceptional 2.8% |
| Thais | 100.0 /100 | #21 | Exceptional 2.8% |
| Mongolians | 100.0 /100 | #22 | Exceptional 2.8% |
| Immigrants | Denmark | 100.0 /100 | #23 | Exceptional 2.8% |
| Israelis | 100.0 /100 | #24 | Exceptional 2.7% |
| Immigrants | Saudi Arabia | 100.0 /100 | #25 | Exceptional 2.7% |
| Turks | 100.0 /100 | #26 | Exceptional 2.7% |
| Immigrants | Turkey | 100.0 /100 | #27 | Exceptional 2.6% |
| Burmese | 100.0 /100 | #28 | Exceptional 2.6% |
| Immigrants | South Central Asia | 100.0 /100 | #29 | Exceptional 2.6% |
| Immigrants | Korea | 100.0 /100 | #30 | Exceptional 2.6% |
| Latvians | 100.0 /100 | #31 | Exceptional 2.6% |
| Immigrants | Northern Europe | 100.0 /100 | #32 | Exceptional 2.6% |