Immigrants from Bosnia and Herzegovina vs Choctaw Doctorate Degree
COMPARE
Immigrants from Bosnia and Herzegovina
Choctaw
Doctorate Degree
Doctorate Degree Comparison
Immigrants from Bosnia and Herzegovina
Choctaw
1.7%
DOCTORATE DEGREE
7.8/ 100
METRIC RATING
223rd/ 347
METRIC RANK
1.4%
DOCTORATE DEGREE
0.3/ 100
METRIC RATING
290th/ 347
METRIC RANK
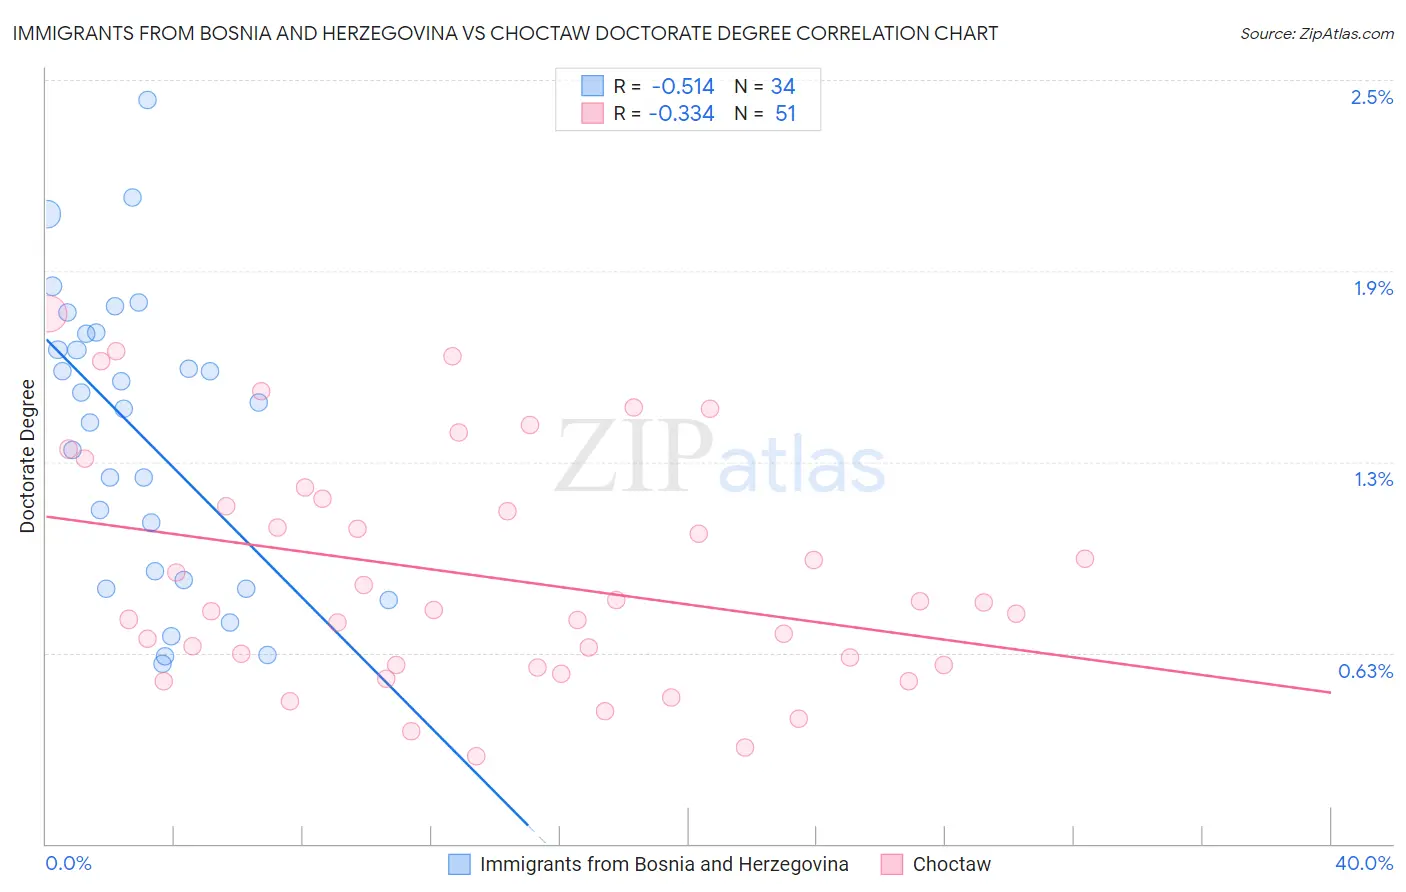
Immigrants from Bosnia and Herzegovina vs Choctaw Doctorate Degree Correlation Chart
The statistical analysis conducted on geographies consisting of 156,366,031 people shows a substantial negative correlation between the proportion of Immigrants from Bosnia and Herzegovina and percentage of population with at least doctorate degree education in the United States with a correlation coefficient (R) of -0.514 and weighted average of 1.7%. Similarly, the statistical analysis conducted on geographies consisting of 265,489,053 people shows a mild negative correlation between the proportion of Choctaw and percentage of population with at least doctorate degree education in the United States with a correlation coefficient (R) of -0.334 and weighted average of 1.4%, a difference of 15.7%.
Doctorate Degree Correlation Summary
| Measurement | Immigrants from Bosnia and Herzegovina | Choctaw |
| Minimum | 0.59% | 0.28% |
| Maximum | 2.4% | 1.7% |
| Range | 1.8% | 1.5% |
| Mean | 1.3% | 0.88% |
| Median | 1.4% | 0.76% |
| Interquartile 25% (IQ1) | 0.86% | 0.59% |
| Interquartile 75% (IQ3) | 1.7% | 1.1% |
| Interquartile Range (IQR) | 0.81% | 0.54% |
| Standard Deviation (Sample) | 0.48% | 0.38% |
| Standard Deviation (Population) | 0.47% | 0.38% |
Similar Demographics by Doctorate Degree
Demographics Similar to Immigrants from Bosnia and Herzegovina by Doctorate Degree
In terms of doctorate degree, the demographic groups most similar to Immigrants from Bosnia and Herzegovina are Immigrants from Poland (1.7%, a difference of 0.22%), Immigrants from Venezuela (1.7%, a difference of 0.46%), Nonimmigrants (1.7%, a difference of 0.53%), Immigrants from Colombia (1.7%, a difference of 0.71%), and Immigrants from Uruguay (1.7%, a difference of 0.72%).
| Demographics | Rating | Rank | Doctorate Degree |
| Immigrants | Burma/Myanmar | 13.5 /100 | #216 | Poor 1.7% |
| Spanish Americans | 12.9 /100 | #217 | Poor 1.7% |
| Tlingit-Haida | 11.9 /100 | #218 | Poor 1.7% |
| Immigrants | Iraq | 10.7 /100 | #219 | Poor 1.7% |
| Immigrants | Uruguay | 9.2 /100 | #220 | Tragic 1.7% |
| Immigrants | Nonimmigrants | 8.8 /100 | #221 | Tragic 1.7% |
| Immigrants | Venezuela | 8.7 /100 | #222 | Tragic 1.7% |
| Immigrants | Bosnia and Herzegovina | 7.8 /100 | #223 | Tragic 1.7% |
| Immigrants | Poland | 7.4 /100 | #224 | Tragic 1.7% |
| Immigrants | Colombia | 6.7 /100 | #225 | Tragic 1.7% |
| Osage | 6.5 /100 | #226 | Tragic 1.7% |
| Panamanians | 6.3 /100 | #227 | Tragic 1.7% |
| Assyrians/Chaldeans/Syriacs | 5.9 /100 | #228 | Tragic 1.7% |
| Colville | 4.7 /100 | #229 | Tragic 1.6% |
| Immigrants | Philippines | 4.3 /100 | #230 | Tragic 1.6% |
Demographics Similar to Choctaw by Doctorate Degree
In terms of doctorate degree, the demographic groups most similar to Choctaw are Cape Verdean (1.4%, a difference of 0.020%), Immigrants from El Salvador (1.4%, a difference of 0.15%), Black/African American (1.4%, a difference of 0.23%), Cajun (1.5%, a difference of 0.33%), and Alaska Native (1.4%, a difference of 0.40%).
| Demographics | Rating | Rank | Doctorate Degree |
| Central Americans | 0.3 /100 | #283 | Tragic 1.5% |
| Jamaicans | 0.3 /100 | #284 | Tragic 1.5% |
| Malaysians | 0.3 /100 | #285 | Tragic 1.5% |
| Cherokee | 0.3 /100 | #286 | Tragic 1.5% |
| Cajuns | 0.3 /100 | #287 | Tragic 1.5% |
| Immigrants | El Salvador | 0.3 /100 | #288 | Tragic 1.4% |
| Cape Verdeans | 0.3 /100 | #289 | Tragic 1.4% |
| Choctaw | 0.3 /100 | #290 | Tragic 1.4% |
| Blacks/African Americans | 0.3 /100 | #291 | Tragic 1.4% |
| Alaska Natives | 0.3 /100 | #292 | Tragic 1.4% |
| Immigrants | Yemen | 0.2 /100 | #293 | Tragic 1.4% |
| Samoans | 0.2 /100 | #294 | Tragic 1.4% |
| Guatemalans | 0.2 /100 | #295 | Tragic 1.4% |
| Immigrants | Ecuador | 0.2 /100 | #296 | Tragic 1.4% |
| Tsimshian | 0.2 /100 | #297 | Tragic 1.4% |