Immigrants from Bosnia and Herzegovina vs Immigrants from Central America Doctorate Degree
COMPARE
Immigrants from Bosnia and Herzegovina
Immigrants from Central America
Doctorate Degree
Doctorate Degree Comparison
Immigrants from Bosnia and Herzegovina
Immigrants from Central America
1.7%
DOCTORATE DEGREE
7.8/ 100
METRIC RATING
223rd/ 347
METRIC RANK
1.2%
DOCTORATE DEGREE
0.0/ 100
METRIC RATING
339th/ 347
METRIC RANK
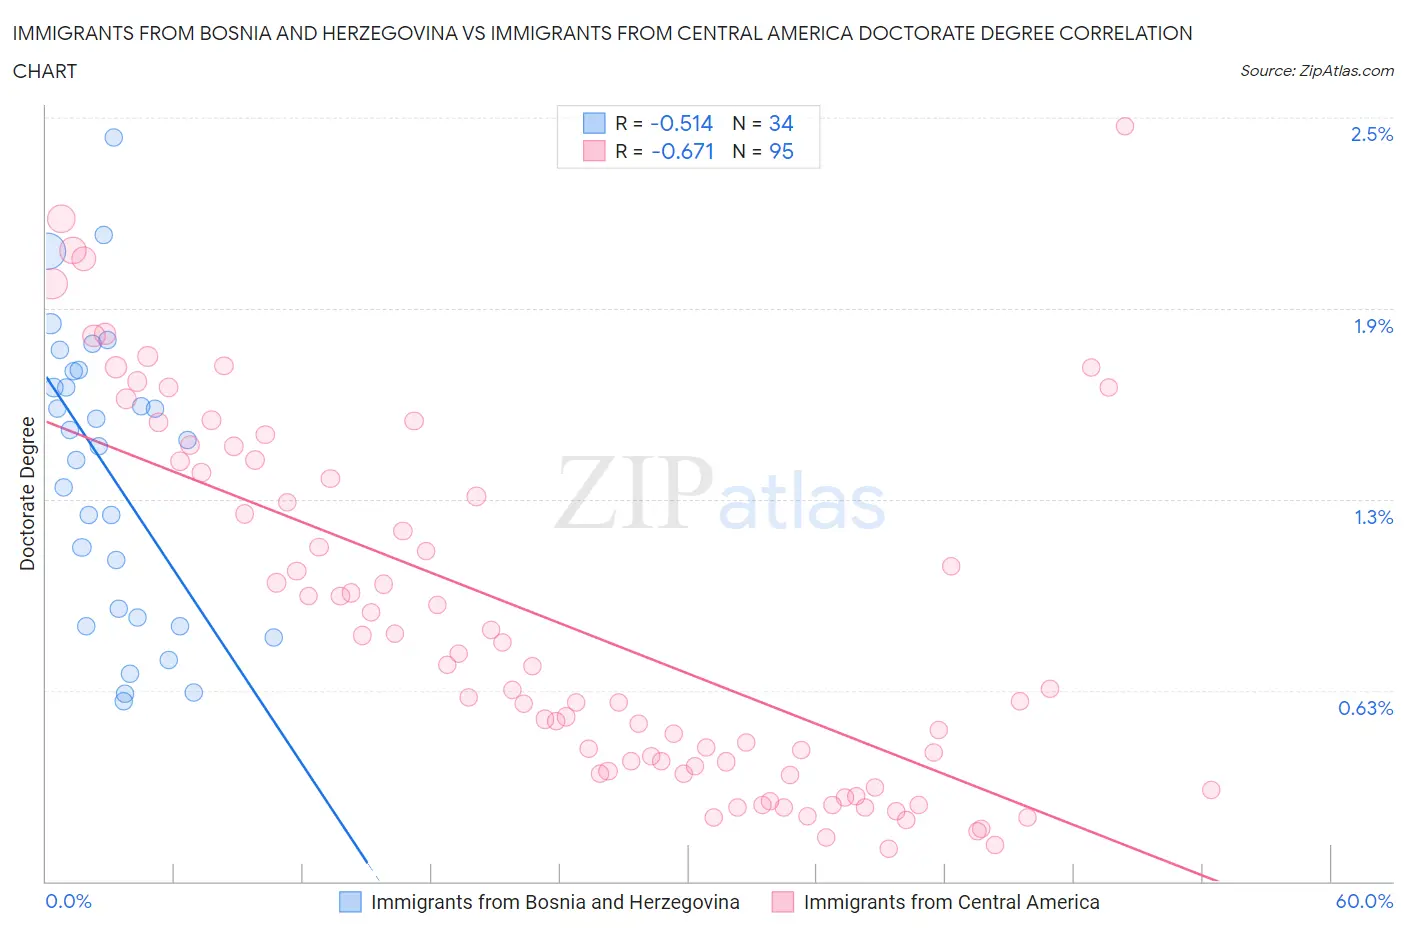
Immigrants from Bosnia and Herzegovina vs Immigrants from Central America Doctorate Degree Correlation Chart
The statistical analysis conducted on geographies consisting of 156,366,031 people shows a substantial negative correlation between the proportion of Immigrants from Bosnia and Herzegovina and percentage of population with at least doctorate degree education in the United States with a correlation coefficient (R) of -0.514 and weighted average of 1.7%. Similarly, the statistical analysis conducted on geographies consisting of 518,565,370 people shows a significant negative correlation between the proportion of Immigrants from Central America and percentage of population with at least doctorate degree education in the United States with a correlation coefficient (R) of -0.671 and weighted average of 1.2%, a difference of 41.0%.
Doctorate Degree Correlation Summary
| Measurement | Immigrants from Bosnia and Herzegovina | Immigrants from Central America |
| Minimum | 0.59% | 0.11% |
| Maximum | 2.4% | 2.5% |
| Range | 1.8% | 2.4% |
| Mean | 1.3% | 0.84% |
| Median | 1.4% | 0.63% |
| Interquartile 25% (IQ1) | 0.86% | 0.35% |
| Interquartile 75% (IQ3) | 1.7% | 1.3% |
| Interquartile Range (IQR) | 0.81% | 0.98% |
| Standard Deviation (Sample) | 0.48% | 0.58% |
| Standard Deviation (Population) | 0.47% | 0.58% |
Similar Demographics by Doctorate Degree
Demographics Similar to Immigrants from Bosnia and Herzegovina by Doctorate Degree
In terms of doctorate degree, the demographic groups most similar to Immigrants from Bosnia and Herzegovina are Immigrants from Poland (1.7%, a difference of 0.22%), Immigrants from Venezuela (1.7%, a difference of 0.46%), Nonimmigrants (1.7%, a difference of 0.53%), Immigrants from Colombia (1.7%, a difference of 0.71%), and Immigrants from Uruguay (1.7%, a difference of 0.72%).
| Demographics | Rating | Rank | Doctorate Degree |
| Immigrants | Burma/Myanmar | 13.5 /100 | #216 | Poor 1.7% |
| Spanish Americans | 12.9 /100 | #217 | Poor 1.7% |
| Tlingit-Haida | 11.9 /100 | #218 | Poor 1.7% |
| Immigrants | Iraq | 10.7 /100 | #219 | Poor 1.7% |
| Immigrants | Uruguay | 9.2 /100 | #220 | Tragic 1.7% |
| Immigrants | Nonimmigrants | 8.8 /100 | #221 | Tragic 1.7% |
| Immigrants | Venezuela | 8.7 /100 | #222 | Tragic 1.7% |
| Immigrants | Bosnia and Herzegovina | 7.8 /100 | #223 | Tragic 1.7% |
| Immigrants | Poland | 7.4 /100 | #224 | Tragic 1.7% |
| Immigrants | Colombia | 6.7 /100 | #225 | Tragic 1.7% |
| Osage | 6.5 /100 | #226 | Tragic 1.7% |
| Panamanians | 6.3 /100 | #227 | Tragic 1.7% |
| Assyrians/Chaldeans/Syriacs | 5.9 /100 | #228 | Tragic 1.7% |
| Colville | 4.7 /100 | #229 | Tragic 1.6% |
| Immigrants | Philippines | 4.3 /100 | #230 | Tragic 1.6% |
Demographics Similar to Immigrants from Central America by Doctorate Degree
In terms of doctorate degree, the demographic groups most similar to Immigrants from Central America are Immigrants from Cuba (1.2%, a difference of 0.81%), Mexican (1.2%, a difference of 1.3%), Puget Sound Salish (1.2%, a difference of 1.3%), Arapaho (1.2%, a difference of 1.7%), and Bangladeshi (1.2%, a difference of 2.1%).
| Demographics | Rating | Rank | Doctorate Degree |
| Yakama | 0.0 /100 | #332 | Tragic 1.3% |
| Immigrants | Caribbean | 0.0 /100 | #333 | Tragic 1.3% |
| Immigrants | Dominican Republic | 0.0 /100 | #334 | Tragic 1.3% |
| Immigrants | Haiti | 0.0 /100 | #335 | Tragic 1.3% |
| Nepalese | 0.0 /100 | #336 | Tragic 1.3% |
| Bangladeshis | 0.0 /100 | #337 | Tragic 1.2% |
| Puget Sound Salish | 0.0 /100 | #338 | Tragic 1.2% |
| Immigrants | Central America | 0.0 /100 | #339 | Tragic 1.2% |
| Immigrants | Cuba | 0.0 /100 | #340 | Tragic 1.2% |
| Mexicans | 0.0 /100 | #341 | Tragic 1.2% |
| Arapaho | 0.0 /100 | #342 | Tragic 1.2% |
| Fijians | 0.0 /100 | #343 | Tragic 1.1% |
| Immigrants | Mexico | 0.0 /100 | #344 | Tragic 1.1% |
| Lumbee | 0.0 /100 | #345 | Tragic 1.1% |
| Spanish American Indians | 0.0 /100 | #346 | Tragic 1.1% |