Immigrants from Bosnia and Herzegovina vs Choctaw In Labor Force | Age 30-34
COMPARE
Immigrants from Bosnia and Herzegovina
Choctaw
In Labor Force | Age 30-34
In Labor Force | Age 30-34 Comparison
Immigrants from Bosnia and Herzegovina
Choctaw
85.8%
IN LABOR FORCE | AGE 30-34
99.9/ 100
METRIC RATING
33rd/ 347
METRIC RANK
81.4%
IN LABOR FORCE | AGE 30-34
0.0/ 100
METRIC RATING
318th/ 347
METRIC RANK
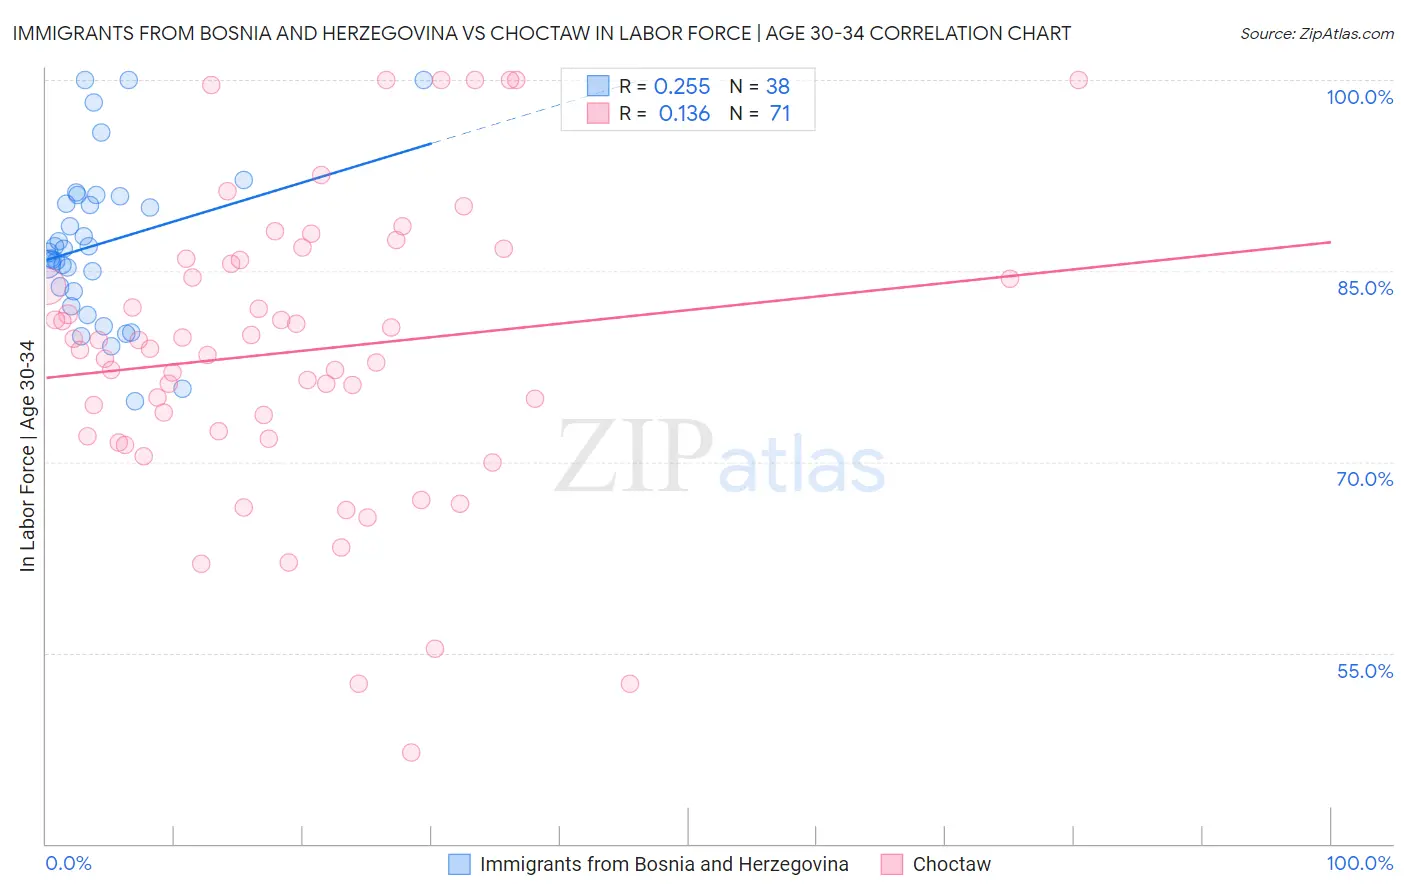
Immigrants from Bosnia and Herzegovina vs Choctaw In Labor Force | Age 30-34 Correlation Chart
The statistical analysis conducted on geographies consisting of 156,800,912 people shows a weak positive correlation between the proportion of Immigrants from Bosnia and Herzegovina and labor force participation rate among population between the ages 30 and 34 in the United States with a correlation coefficient (R) of 0.255 and weighted average of 85.8%. Similarly, the statistical analysis conducted on geographies consisting of 269,615,470 people shows a poor positive correlation between the proportion of Choctaw and labor force participation rate among population between the ages 30 and 34 in the United States with a correlation coefficient (R) of 0.136 and weighted average of 81.4%, a difference of 5.3%.
In Labor Force | Age 30-34 Correlation Summary
| Measurement | Immigrants from Bosnia and Herzegovina | Choctaw |
| Minimum | 74.8% | 47.2% |
| Maximum | 100.0% | 100.0% |
| Range | 25.2% | 52.8% |
| Mean | 87.1% | 78.7% |
| Median | 86.6% | 78.9% |
| Interquartile 25% (IQ1) | 83.4% | 72.0% |
| Interquartile 75% (IQ3) | 90.8% | 85.9% |
| Interquartile Range (IQR) | 7.5% | 13.9% |
| Standard Deviation (Sample) | 6.3% | 11.6% |
| Standard Deviation (Population) | 6.2% | 11.5% |
Similar Demographics by In Labor Force | Age 30-34
Demographics Similar to Immigrants from Bosnia and Herzegovina by In Labor Force | Age 30-34
In terms of in labor force | age 30-34, the demographic groups most similar to Immigrants from Bosnia and Herzegovina are Ugandan (85.8%, a difference of 0.0%), Serbian (85.8%, a difference of 0.010%), Albanian (85.7%, a difference of 0.010%), Norwegian (85.7%, a difference of 0.020%), and Immigrants from Greece (85.7%, a difference of 0.030%).
| Demographics | Rating | Rank | In Labor Force | Age 30-34 |
| Immigrants | Eastern Africa | 100.0 /100 | #26 | Exceptional 85.9% |
| Immigrants | Liberia | 100.0 /100 | #27 | Exceptional 85.9% |
| Immigrants | Latvia | 100.0 /100 | #28 | Exceptional 85.9% |
| Tsimshian | 100.0 /100 | #29 | Exceptional 85.8% |
| Immigrants | Hong Kong | 100.0 /100 | #30 | Exceptional 85.8% |
| Paraguayans | 99.9 /100 | #31 | Exceptional 85.8% |
| Cypriots | 99.9 /100 | #32 | Exceptional 85.8% |
| Immigrants | Bosnia and Herzegovina | 99.9 /100 | #33 | Exceptional 85.8% |
| Ugandans | 99.9 /100 | #34 | Exceptional 85.8% |
| Serbians | 99.9 /100 | #35 | Exceptional 85.8% |
| Albanians | 99.9 /100 | #36 | Exceptional 85.7% |
| Norwegians | 99.9 /100 | #37 | Exceptional 85.7% |
| Immigrants | Greece | 99.9 /100 | #38 | Exceptional 85.7% |
| Eastern Europeans | 99.9 /100 | #39 | Exceptional 85.7% |
| Turks | 99.9 /100 | #40 | Exceptional 85.7% |
Demographics Similar to Choctaw by In Labor Force | Age 30-34
In terms of in labor force | age 30-34, the demographic groups most similar to Choctaw are Shoshone (81.4%, a difference of 0.0%), Yaqui (81.4%, a difference of 0.020%), Immigrants from the Azores (81.5%, a difference of 0.080%), Arapaho (81.5%, a difference of 0.080%), and Alaska Native (81.3%, a difference of 0.10%).
| Demographics | Rating | Rank | In Labor Force | Age 30-34 |
| Chickasaw | 0.0 /100 | #311 | Tragic 81.9% |
| Mexicans | 0.0 /100 | #312 | Tragic 81.9% |
| Iroquois | 0.0 /100 | #313 | Tragic 81.9% |
| Alaskan Athabascans | 0.0 /100 | #314 | Tragic 81.7% |
| Cherokee | 0.0 /100 | #315 | Tragic 81.6% |
| Immigrants | Azores | 0.0 /100 | #316 | Tragic 81.5% |
| Arapaho | 0.0 /100 | #317 | Tragic 81.5% |
| Choctaw | 0.0 /100 | #318 | Tragic 81.4% |
| Shoshone | 0.0 /100 | #319 | Tragic 81.4% |
| Yaqui | 0.0 /100 | #320 | Tragic 81.4% |
| Alaska Natives | 0.0 /100 | #321 | Tragic 81.3% |
| Puerto Ricans | 0.0 /100 | #322 | Tragic 81.2% |
| Paiute | 0.0 /100 | #323 | Tragic 81.2% |
| Cheyenne | 0.0 /100 | #324 | Tragic 81.1% |
| Dutch West Indians | 0.0 /100 | #325 | Tragic 81.0% |