Alaskan Athabascan vs Choctaw Doctorate Degree
COMPARE
Alaskan Athabascan
Choctaw
Doctorate Degree
Doctorate Degree Comparison
Alaskan Athabascans
Choctaw
1.7%
DOCTORATE DEGREE
13.8/ 100
METRIC RATING
215th/ 347
METRIC RANK
1.4%
DOCTORATE DEGREE
0.3/ 100
METRIC RATING
290th/ 347
METRIC RANK
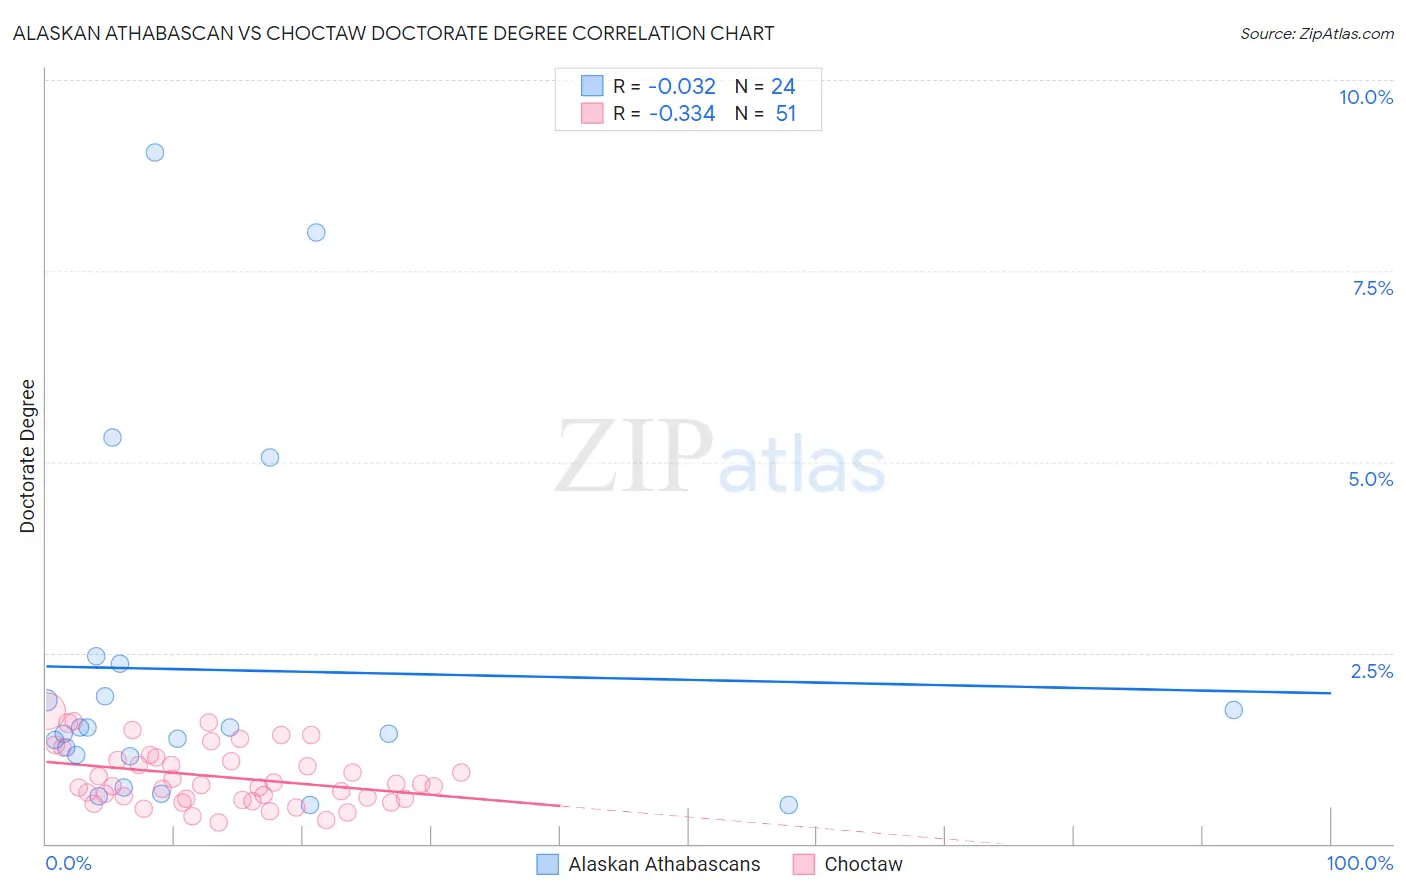
Alaskan Athabascan vs Choctaw Doctorate Degree Correlation Chart
The statistical analysis conducted on geographies consisting of 45,553,512 people shows no correlation between the proportion of Alaskan Athabascans and percentage of population with at least doctorate degree education in the United States with a correlation coefficient (R) of -0.032 and weighted average of 1.7%. Similarly, the statistical analysis conducted on geographies consisting of 265,489,053 people shows a mild negative correlation between the proportion of Choctaw and percentage of population with at least doctorate degree education in the United States with a correlation coefficient (R) of -0.334 and weighted average of 1.4%, a difference of 18.6%.
Doctorate Degree Correlation Summary
| Measurement | Alaskan Athabascan | Choctaw |
| Minimum | 0.51% | 0.28% |
| Maximum | 9.0% | 1.7% |
| Range | 8.5% | 1.5% |
| Mean | 2.3% | 0.88% |
| Median | 1.5% | 0.76% |
| Interquartile 25% (IQ1) | 1.2% | 0.59% |
| Interquartile 75% (IQ3) | 2.1% | 1.1% |
| Interquartile Range (IQR) | 0.98% | 0.54% |
| Standard Deviation (Sample) | 2.3% | 0.38% |
| Standard Deviation (Population) | 2.2% | 0.38% |
Similar Demographics by Doctorate Degree
Demographics Similar to Alaskan Athabascans by Doctorate Degree
In terms of doctorate degree, the demographic groups most similar to Alaskan Athabascans are Immigrants from Burma/Myanmar (1.7%, a difference of 0.10%), Pueblo (1.7%, a difference of 0.14%), Korean (1.7%, a difference of 0.15%), Immigrants from South Eastern Asia (1.7%, a difference of 0.29%), and Spanish American (1.7%, a difference of 0.31%).
| Demographics | Rating | Rank | Doctorate Degree |
| Colombians | 16.1 /100 | #208 | Poor 1.7% |
| Immigrants | Western Africa | 15.4 /100 | #209 | Poor 1.7% |
| Tongans | 15.1 /100 | #210 | Poor 1.7% |
| Immigrants | Armenia | 15.1 /100 | #211 | Poor 1.7% |
| Immigrants | South Eastern Asia | 14.7 /100 | #212 | Poor 1.7% |
| Koreans | 14.2 /100 | #213 | Poor 1.7% |
| Pueblo | 14.2 /100 | #214 | Poor 1.7% |
| Alaskan Athabascans | 13.8 /100 | #215 | Poor 1.7% |
| Immigrants | Burma/Myanmar | 13.5 /100 | #216 | Poor 1.7% |
| Spanish Americans | 12.9 /100 | #217 | Poor 1.7% |
| Tlingit-Haida | 11.9 /100 | #218 | Poor 1.7% |
| Immigrants | Iraq | 10.7 /100 | #219 | Poor 1.7% |
| Immigrants | Uruguay | 9.2 /100 | #220 | Tragic 1.7% |
| Immigrants | Nonimmigrants | 8.8 /100 | #221 | Tragic 1.7% |
| Immigrants | Venezuela | 8.7 /100 | #222 | Tragic 1.7% |
Demographics Similar to Choctaw by Doctorate Degree
In terms of doctorate degree, the demographic groups most similar to Choctaw are Cape Verdean (1.4%, a difference of 0.020%), Immigrants from El Salvador (1.4%, a difference of 0.15%), Black/African American (1.4%, a difference of 0.23%), Cajun (1.5%, a difference of 0.33%), and Alaska Native (1.4%, a difference of 0.40%).
| Demographics | Rating | Rank | Doctorate Degree |
| Central Americans | 0.3 /100 | #283 | Tragic 1.5% |
| Jamaicans | 0.3 /100 | #284 | Tragic 1.5% |
| Malaysians | 0.3 /100 | #285 | Tragic 1.5% |
| Cherokee | 0.3 /100 | #286 | Tragic 1.5% |
| Cajuns | 0.3 /100 | #287 | Tragic 1.5% |
| Immigrants | El Salvador | 0.3 /100 | #288 | Tragic 1.4% |
| Cape Verdeans | 0.3 /100 | #289 | Tragic 1.4% |
| Choctaw | 0.3 /100 | #290 | Tragic 1.4% |
| Blacks/African Americans | 0.3 /100 | #291 | Tragic 1.4% |
| Alaska Natives | 0.3 /100 | #292 | Tragic 1.4% |
| Immigrants | Yemen | 0.2 /100 | #293 | Tragic 1.4% |
| Samoans | 0.2 /100 | #294 | Tragic 1.4% |
| Guatemalans | 0.2 /100 | #295 | Tragic 1.4% |
| Immigrants | Ecuador | 0.2 /100 | #296 | Tragic 1.4% |
| Tsimshian | 0.2 /100 | #297 | Tragic 1.4% |