Immigrants from Bolivia vs Ottawa 11th Grade
COMPARE
Immigrants from Bolivia
Ottawa
11th Grade
11th Grade Comparison
Immigrants from Bolivia
Ottawa
91.7%
11TH GRADE
2.8/ 100
METRIC RATING
237th/ 347
METRIC RANK
93.6%
11TH GRADE
99.2/ 100
METRIC RATING
90th/ 347
METRIC RANK
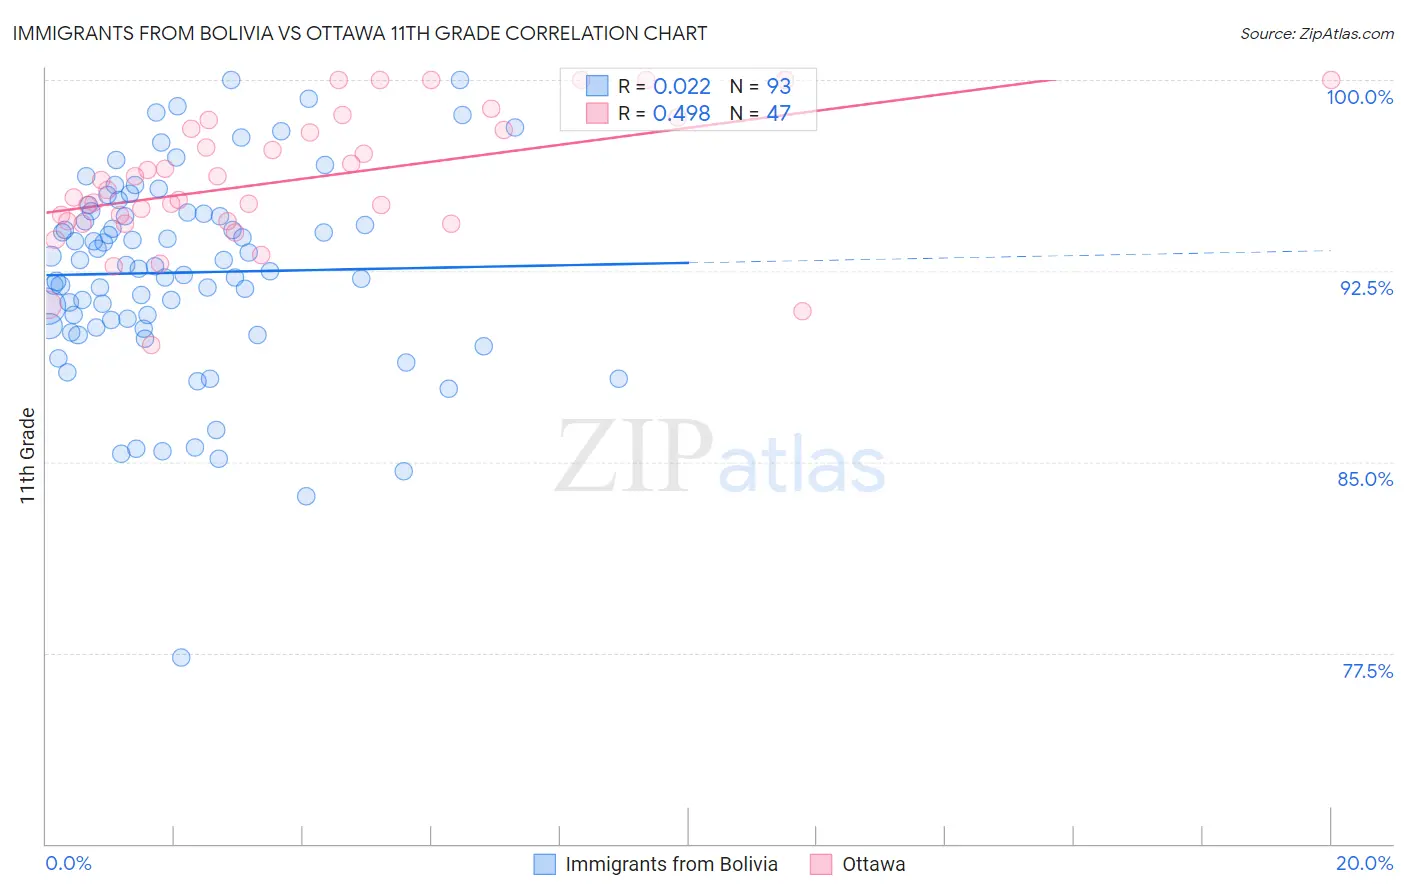
Immigrants from Bolivia vs Ottawa 11th Grade Correlation Chart
The statistical analysis conducted on geographies consisting of 158,727,043 people shows no correlation between the proportion of Immigrants from Bolivia and percentage of population with at least 11th grade education in the United States with a correlation coefficient (R) of 0.022 and weighted average of 91.7%. Similarly, the statistical analysis conducted on geographies consisting of 49,956,602 people shows a moderate positive correlation between the proportion of Ottawa and percentage of population with at least 11th grade education in the United States with a correlation coefficient (R) of 0.498 and weighted average of 93.6%, a difference of 2.1%.
11th Grade Correlation Summary
| Measurement | Immigrants from Bolivia | Ottawa |
| Minimum | 77.3% | 89.6% |
| Maximum | 100.0% | 100.0% |
| Range | 22.7% | 10.4% |
| Mean | 92.4% | 96.1% |
| Median | 92.7% | 95.7% |
| Interquartile 25% (IQ1) | 90.3% | 94.4% |
| Interquartile 75% (IQ3) | 94.8% | 98.1% |
| Interquartile Range (IQR) | 4.5% | 3.6% |
| Standard Deviation (Sample) | 4.0% | 2.6% |
| Standard Deviation (Population) | 3.9% | 2.6% |
Similar Demographics by 11th Grade
Demographics Similar to Immigrants from Bolivia by 11th Grade
In terms of 11th grade, the demographic groups most similar to Immigrants from Bolivia are Subsaharan African (91.7%, a difference of 0.0%), Colombian (91.7%, a difference of 0.0%), Armenian (91.7%, a difference of 0.010%), Comanche (91.7%, a difference of 0.020%), and Hopi (91.7%, a difference of 0.030%).
| Demographics | Rating | Rank | 11th Grade |
| Immigrants | Afghanistan | 3.9 /100 | #230 | Tragic 91.8% |
| Choctaw | 3.7 /100 | #231 | Tragic 91.8% |
| Uruguayans | 3.5 /100 | #232 | Tragic 91.8% |
| Cheyenne | 3.3 /100 | #233 | Tragic 91.8% |
| Armenians | 2.9 /100 | #234 | Tragic 91.7% |
| Sub-Saharan Africans | 2.9 /100 | #235 | Tragic 91.7% |
| Colombians | 2.8 /100 | #236 | Tragic 91.7% |
| Immigrants | Bolivia | 2.8 /100 | #237 | Tragic 91.7% |
| Comanche | 2.6 /100 | #238 | Tragic 91.7% |
| Hopi | 2.5 /100 | #239 | Tragic 91.7% |
| South Americans | 2.0 /100 | #240 | Tragic 91.6% |
| Bahamians | 1.8 /100 | #241 | Tragic 91.6% |
| Immigrants | Middle Africa | 1.6 /100 | #242 | Tragic 91.6% |
| Immigrants | Thailand | 1.4 /100 | #243 | Tragic 91.6% |
| Senegalese | 1.4 /100 | #244 | Tragic 91.6% |
Demographics Similar to Ottawa by 11th Grade
In terms of 11th grade, the demographic groups most similar to Ottawa are Immigrants from South Central Asia (93.6%, a difference of 0.010%), Immigrants from Western Europe (93.6%, a difference of 0.010%), Cambodian (93.6%, a difference of 0.010%), Burmese (93.6%, a difference of 0.010%), and South African (93.6%, a difference of 0.010%).
| Demographics | Rating | Rank | 11th Grade |
| Icelanders | 99.3 /100 | #83 | Exceptional 93.6% |
| Immigrants | Taiwan | 99.3 /100 | #84 | Exceptional 93.6% |
| Immigrants | Switzerland | 99.3 /100 | #85 | Exceptional 93.6% |
| Immigrants | South Central Asia | 99.2 /100 | #86 | Exceptional 93.6% |
| Immigrants | Western Europe | 99.2 /100 | #87 | Exceptional 93.6% |
| Cambodians | 99.2 /100 | #88 | Exceptional 93.6% |
| Burmese | 99.2 /100 | #89 | Exceptional 93.6% |
| Ottawa | 99.2 /100 | #90 | Exceptional 93.6% |
| South Africans | 99.2 /100 | #91 | Exceptional 93.6% |
| Immigrants | Bulgaria | 99.1 /100 | #92 | Exceptional 93.6% |
| Puget Sound Salish | 99.1 /100 | #93 | Exceptional 93.6% |
| Swiss | 99.0 /100 | #94 | Exceptional 93.6% |
| Immigrants | France | 99.0 /100 | #95 | Exceptional 93.6% |
| Immigrants | Turkey | 98.9 /100 | #96 | Exceptional 93.5% |
| Immigrants | Iran | 98.9 /100 | #97 | Exceptional 93.5% |