Immigrants from Iran vs Ottawa 11th Grade
COMPARE
Immigrants from Iran
Ottawa
11th Grade
11th Grade Comparison
Immigrants from Iran
Ottawa
93.5%
11TH GRADE
98.9/ 100
METRIC RATING
97th/ 347
METRIC RANK
93.6%
11TH GRADE
99.2/ 100
METRIC RATING
90th/ 347
METRIC RANK
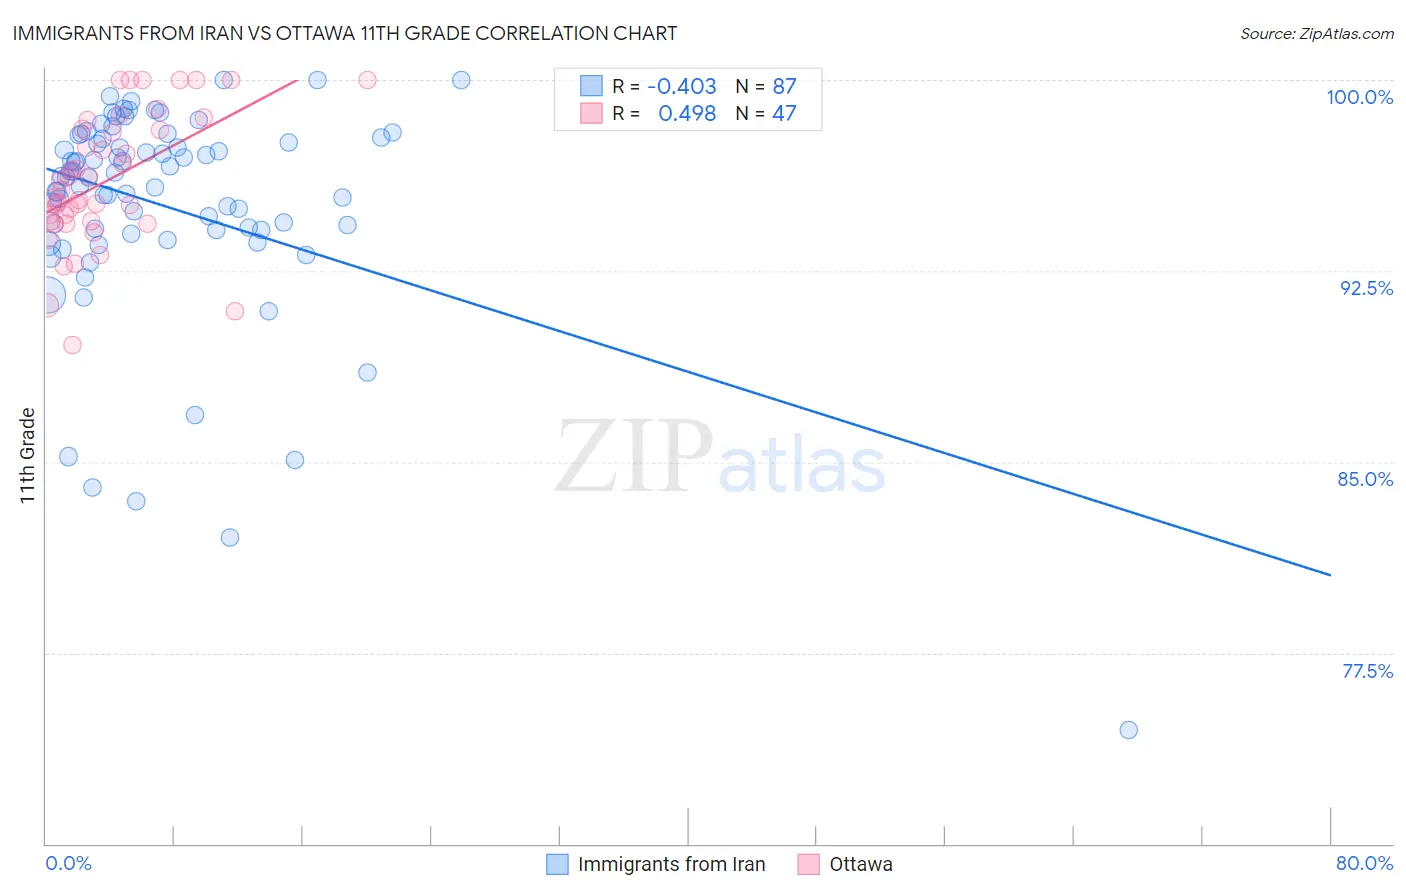
Immigrants from Iran vs Ottawa 11th Grade Correlation Chart
The statistical analysis conducted on geographies consisting of 279,905,207 people shows a moderate negative correlation between the proportion of Immigrants from Iran and percentage of population with at least 11th grade education in the United States with a correlation coefficient (R) of -0.403 and weighted average of 93.5%. Similarly, the statistical analysis conducted on geographies consisting of 49,956,602 people shows a moderate positive correlation between the proportion of Ottawa and percentage of population with at least 11th grade education in the United States with a correlation coefficient (R) of 0.498 and weighted average of 93.6%, a difference of 0.090%.
11th Grade Correlation Summary
| Measurement | Immigrants from Iran | Ottawa |
| Minimum | 74.5% | 89.6% |
| Maximum | 100.0% | 100.0% |
| Range | 25.5% | 10.4% |
| Mean | 95.0% | 96.1% |
| Median | 96.2% | 95.7% |
| Interquartile 25% (IQ1) | 94.1% | 94.4% |
| Interquartile 75% (IQ3) | 97.7% | 98.1% |
| Interquartile Range (IQR) | 3.6% | 3.6% |
| Standard Deviation (Sample) | 4.3% | 2.6% |
| Standard Deviation (Population) | 4.3% | 2.6% |
Demographics Similar to Immigrants from Iran and Ottawa by 11th Grade
In terms of 11th grade, the demographic groups most similar to Immigrants from Iran are Immigrants from Turkey (93.5%, a difference of 0.010%), Immigrants from Israel (93.5%, a difference of 0.020%), Menominee (93.5%, a difference of 0.020%), Swiss (93.6%, a difference of 0.030%), and Immigrants from France (93.6%, a difference of 0.030%). Similarly, the demographic groups most similar to Ottawa are Immigrants from South Central Asia (93.6%, a difference of 0.010%), Immigrants from Western Europe (93.6%, a difference of 0.010%), Cambodian (93.6%, a difference of 0.010%), Burmese (93.6%, a difference of 0.010%), and South African (93.6%, a difference of 0.010%).
| Demographics | Rating | Rank | 11th Grade |
| Icelanders | 99.3 /100 | #83 | Exceptional 93.6% |
| Immigrants | Taiwan | 99.3 /100 | #84 | Exceptional 93.6% |
| Immigrants | Switzerland | 99.3 /100 | #85 | Exceptional 93.6% |
| Immigrants | South Central Asia | 99.2 /100 | #86 | Exceptional 93.6% |
| Immigrants | Western Europe | 99.2 /100 | #87 | Exceptional 93.6% |
| Cambodians | 99.2 /100 | #88 | Exceptional 93.6% |
| Burmese | 99.2 /100 | #89 | Exceptional 93.6% |
| Ottawa | 99.2 /100 | #90 | Exceptional 93.6% |
| South Africans | 99.2 /100 | #91 | Exceptional 93.6% |
| Immigrants | Bulgaria | 99.1 /100 | #92 | Exceptional 93.6% |
| Puget Sound Salish | 99.1 /100 | #93 | Exceptional 93.6% |
| Swiss | 99.0 /100 | #94 | Exceptional 93.6% |
| Immigrants | France | 99.0 /100 | #95 | Exceptional 93.6% |
| Immigrants | Turkey | 98.9 /100 | #96 | Exceptional 93.5% |
| Immigrants | Iran | 98.9 /100 | #97 | Exceptional 93.5% |
| Immigrants | Israel | 98.8 /100 | #98 | Exceptional 93.5% |
| Menominee | 98.7 /100 | #99 | Exceptional 93.5% |
| Immigrants | North Macedonia | 98.7 /100 | #100 | Exceptional 93.5% |
| Immigrants | Romania | 98.7 /100 | #101 | Exceptional 93.5% |
| Chippewa | 98.6 /100 | #102 | Exceptional 93.5% |
| Lebanese | 98.6 /100 | #103 | Exceptional 93.5% |