Cherokee vs Ottawa 11th Grade
COMPARE
Cherokee
Ottawa
11th Grade
11th Grade Comparison
Cherokee
Ottawa
92.4%
11TH GRADE
40.7/ 100
METRIC RATING
181st/ 347
METRIC RANK
93.6%
11TH GRADE
99.2/ 100
METRIC RATING
90th/ 347
METRIC RANK
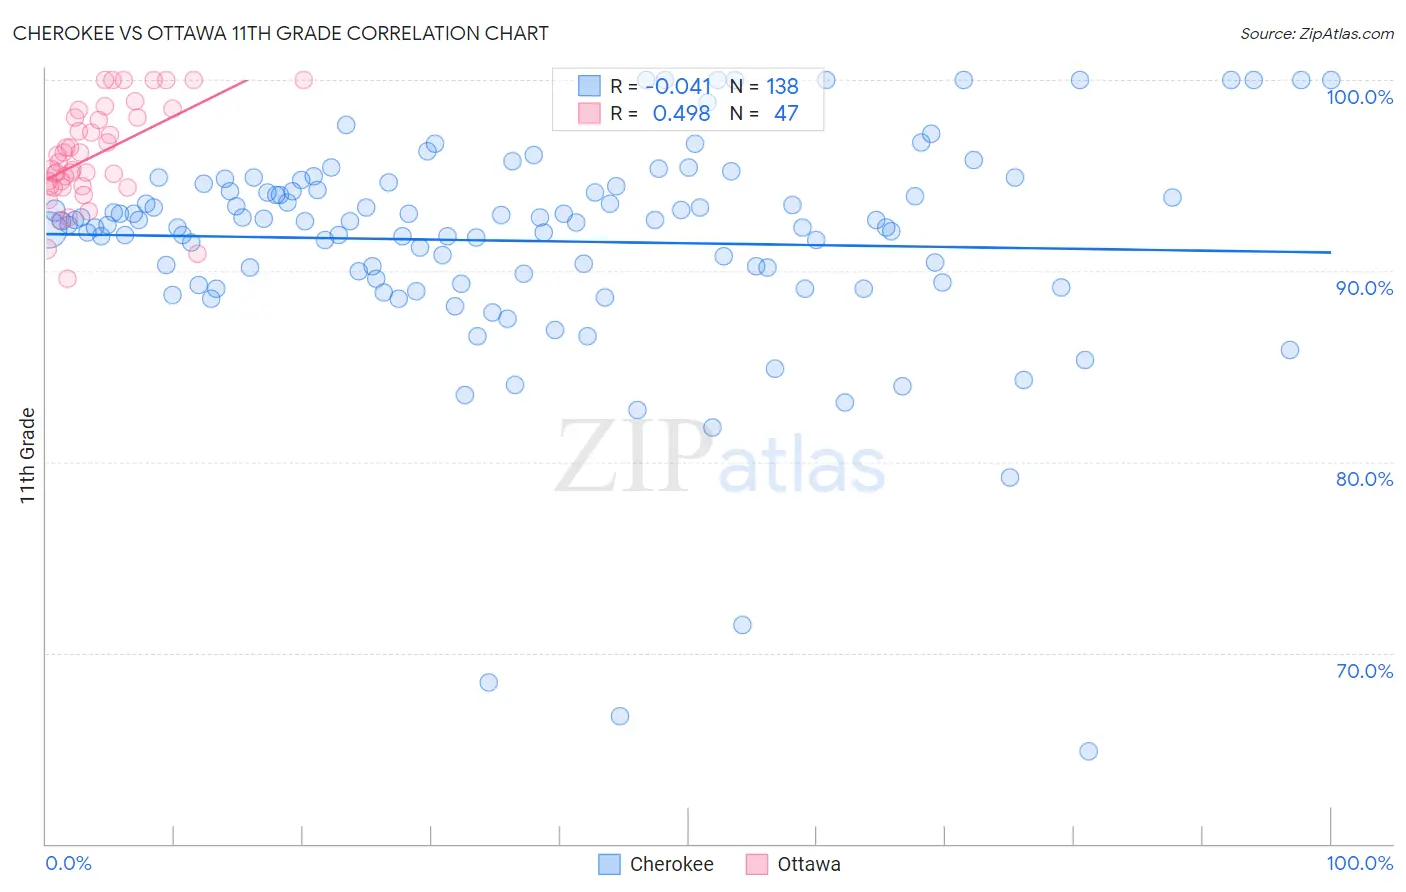
Cherokee vs Ottawa 11th Grade Correlation Chart
The statistical analysis conducted on geographies consisting of 493,720,047 people shows no correlation between the proportion of Cherokee and percentage of population with at least 11th grade education in the United States with a correlation coefficient (R) of -0.041 and weighted average of 92.4%. Similarly, the statistical analysis conducted on geographies consisting of 49,956,602 people shows a moderate positive correlation between the proportion of Ottawa and percentage of population with at least 11th grade education in the United States with a correlation coefficient (R) of 0.498 and weighted average of 93.6%, a difference of 1.3%.
11th Grade Correlation Summary
| Measurement | Cherokee | Ottawa |
| Minimum | 64.9% | 89.6% |
| Maximum | 100.0% | 100.0% |
| Range | 35.1% | 10.4% |
| Mean | 91.6% | 96.1% |
| Median | 92.6% | 95.7% |
| Interquartile 25% (IQ1) | 89.6% | 94.4% |
| Interquartile 75% (IQ3) | 94.2% | 98.1% |
| Interquartile Range (IQR) | 4.6% | 3.6% |
| Standard Deviation (Sample) | 5.8% | 2.6% |
| Standard Deviation (Population) | 5.8% | 2.6% |
Similar Demographics by 11th Grade
Demographics Similar to Cherokee by 11th Grade
In terms of 11th grade, the demographic groups most similar to Cherokee are Creek (92.4%, a difference of 0.0%), Inupiat (92.4%, a difference of 0.0%), Immigrants from Morocco (92.4%, a difference of 0.020%), Sudanese (92.5%, a difference of 0.030%), and Immigrants from Malaysia (92.4%, a difference of 0.030%).
| Demographics | Rating | Rank | 11th Grade |
| Asians | 50.0 /100 | #174 | Average 92.5% |
| Shoshone | 48.9 /100 | #175 | Average 92.5% |
| Spaniards | 46.9 /100 | #176 | Average 92.5% |
| Guamanians/Chamorros | 45.0 /100 | #177 | Average 92.5% |
| Sudanese | 43.4 /100 | #178 | Average 92.5% |
| Creek | 40.9 /100 | #179 | Average 92.4% |
| Inupiat | 40.7 /100 | #180 | Average 92.4% |
| Cherokee | 40.7 /100 | #181 | Average 92.4% |
| Immigrants | Morocco | 38.6 /100 | #182 | Fair 92.4% |
| Immigrants | Malaysia | 37.6 /100 | #183 | Fair 92.4% |
| Immigrants | Asia | 37.4 /100 | #184 | Fair 92.4% |
| Immigrants | Nepal | 36.4 /100 | #185 | Fair 92.4% |
| Arapaho | 35.1 /100 | #186 | Fair 92.4% |
| Immigrants | Western Asia | 35.0 /100 | #187 | Fair 92.4% |
| Immigrants | Indonesia | 33.7 /100 | #188 | Fair 92.4% |
Demographics Similar to Ottawa by 11th Grade
In terms of 11th grade, the demographic groups most similar to Ottawa are Immigrants from South Central Asia (93.6%, a difference of 0.010%), Immigrants from Western Europe (93.6%, a difference of 0.010%), Cambodian (93.6%, a difference of 0.010%), Burmese (93.6%, a difference of 0.010%), and South African (93.6%, a difference of 0.010%).
| Demographics | Rating | Rank | 11th Grade |
| Icelanders | 99.3 /100 | #83 | Exceptional 93.6% |
| Immigrants | Taiwan | 99.3 /100 | #84 | Exceptional 93.6% |
| Immigrants | Switzerland | 99.3 /100 | #85 | Exceptional 93.6% |
| Immigrants | South Central Asia | 99.2 /100 | #86 | Exceptional 93.6% |
| Immigrants | Western Europe | 99.2 /100 | #87 | Exceptional 93.6% |
| Cambodians | 99.2 /100 | #88 | Exceptional 93.6% |
| Burmese | 99.2 /100 | #89 | Exceptional 93.6% |
| Ottawa | 99.2 /100 | #90 | Exceptional 93.6% |
| South Africans | 99.2 /100 | #91 | Exceptional 93.6% |
| Immigrants | Bulgaria | 99.1 /100 | #92 | Exceptional 93.6% |
| Puget Sound Salish | 99.1 /100 | #93 | Exceptional 93.6% |
| Swiss | 99.0 /100 | #94 | Exceptional 93.6% |
| Immigrants | France | 99.0 /100 | #95 | Exceptional 93.6% |
| Immigrants | Turkey | 98.9 /100 | #96 | Exceptional 93.5% |
| Immigrants | Iran | 98.9 /100 | #97 | Exceptional 93.5% |