Immigrants from Belgium vs Immigrants from Liberia College, Under 1 year
COMPARE
Immigrants from Belgium
Immigrants from Liberia
College, Under 1 year
College, Under 1 year Comparison
Immigrants from Belgium
Immigrants from Liberia
71.5%
COLLEGE, UNDER 1 YEAR
100.0/ 100
METRIC RATING
21st/ 347
METRIC RANK
61.9%
COLLEGE, UNDER 1 YEAR
0.8/ 100
METRIC RATING
247th/ 347
METRIC RANK
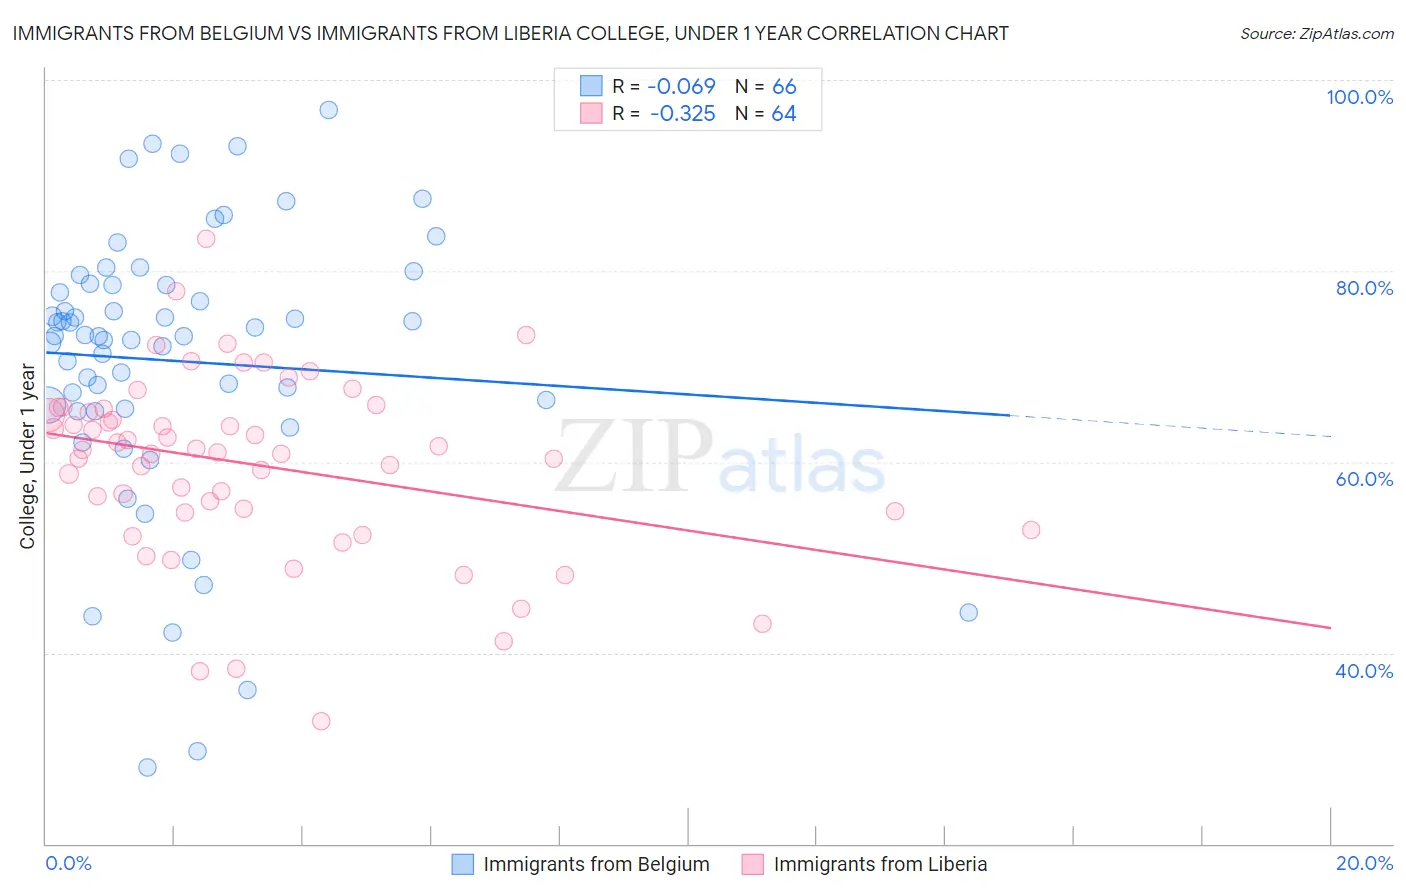
Immigrants from Belgium vs Immigrants from Liberia College, Under 1 year Correlation Chart
The statistical analysis conducted on geographies consisting of 146,729,232 people shows a slight negative correlation between the proportion of Immigrants from Belgium and percentage of population with at least college, under 1 year education in the United States with a correlation coefficient (R) of -0.069 and weighted average of 71.5%. Similarly, the statistical analysis conducted on geographies consisting of 135,295,665 people shows a mild negative correlation between the proportion of Immigrants from Liberia and percentage of population with at least college, under 1 year education in the United States with a correlation coefficient (R) of -0.325 and weighted average of 61.9%, a difference of 15.4%.
College, Under 1 year Correlation Summary
| Measurement | Immigrants from Belgium | Immigrants from Liberia |
| Minimum | 28.0% | 32.8% |
| Maximum | 96.9% | 83.3% |
| Range | 68.9% | 50.5% |
| Mean | 70.6% | 59.7% |
| Median | 73.2% | 61.1% |
| Interquartile 25% (IQ1) | 65.6% | 54.8% |
| Interquartile 75% (IQ3) | 78.5% | 65.4% |
| Interquartile Range (IQR) | 13.0% | 10.6% |
| Standard Deviation (Sample) | 14.5% | 9.6% |
| Standard Deviation (Population) | 14.4% | 9.5% |
Similar Demographics by College, Under 1 year
Demographics Similar to Immigrants from Belgium by College, Under 1 year
In terms of college, under 1 year, the demographic groups most similar to Immigrants from Belgium are Immigrants from Korea (71.6%, a difference of 0.15%), Latvian (71.6%, a difference of 0.19%), Immigrants from Eastern Asia (71.3%, a difference of 0.25%), Immigrants from Switzerland (71.7%, a difference of 0.30%), and Eastern European (71.8%, a difference of 0.43%).
| Demographics | Rating | Rank | College, Under 1 year |
| Cambodians | 100.0 /100 | #14 | Exceptional 71.9% |
| Burmese | 100.0 /100 | #15 | Exceptional 71.9% |
| Immigrants | Japan | 100.0 /100 | #16 | Exceptional 71.9% |
| Eastern Europeans | 100.0 /100 | #17 | Exceptional 71.8% |
| Immigrants | Switzerland | 100.0 /100 | #18 | Exceptional 71.7% |
| Latvians | 100.0 /100 | #19 | Exceptional 71.6% |
| Immigrants | Korea | 100.0 /100 | #20 | Exceptional 71.6% |
| Immigrants | Belgium | 100.0 /100 | #21 | Exceptional 71.5% |
| Immigrants | Eastern Asia | 100.0 /100 | #22 | Exceptional 71.3% |
| Immigrants | Northern Europe | 100.0 /100 | #23 | Exceptional 71.1% |
| Soviet Union | 100.0 /100 | #24 | Exceptional 71.1% |
| Bulgarians | 100.0 /100 | #25 | Exceptional 71.1% |
| Immigrants | Denmark | 100.0 /100 | #26 | Exceptional 71.0% |
| Immigrants | Ireland | 100.0 /100 | #27 | Exceptional 71.0% |
| Immigrants | Hong Kong | 100.0 /100 | #28 | Exceptional 71.0% |
Demographics Similar to Immigrants from Liberia by College, Under 1 year
In terms of college, under 1 year, the demographic groups most similar to Immigrants from Liberia are Marshallese (61.9%, a difference of 0.020%), Potawatomi (61.8%, a difference of 0.23%), Delaware (62.1%, a difference of 0.25%), Colville (62.1%, a difference of 0.31%), and Hawaiian (62.1%, a difference of 0.40%).
| Demographics | Rating | Rank | College, Under 1 year |
| Aleuts | 1.1 /100 | #240 | Tragic 62.2% |
| Ottawa | 1.1 /100 | #241 | Tragic 62.2% |
| Malaysians | 1.1 /100 | #242 | Tragic 62.2% |
| Hawaiians | 1.1 /100 | #243 | Tragic 62.1% |
| Colville | 1.0 /100 | #244 | Tragic 62.1% |
| Delaware | 0.9 /100 | #245 | Tragic 62.1% |
| Marshallese | 0.8 /100 | #246 | Tragic 61.9% |
| Immigrants | Liberia | 0.8 /100 | #247 | Tragic 61.9% |
| Potawatomi | 0.6 /100 | #248 | Tragic 61.8% |
| Vietnamese | 0.5 /100 | #249 | Tragic 61.7% |
| Immigrants | Congo | 0.5 /100 | #250 | Tragic 61.7% |
| Immigrants | Micronesia | 0.5 /100 | #251 | Tragic 61.5% |
| West Indians | 0.4 /100 | #252 | Tragic 61.5% |
| Japanese | 0.4 /100 | #253 | Tragic 61.5% |
| Immigrants | Cambodia | 0.4 /100 | #254 | Tragic 61.5% |