Central American Indian vs Immigrants from Liberia College, Under 1 year
COMPARE
Central American Indian
Immigrants from Liberia
College, Under 1 year
College, Under 1 year Comparison
Central American Indians
Immigrants from Liberia
59.0%
COLLEGE, UNDER 1 YEAR
0.0/ 100
METRIC RATING
296th/ 347
METRIC RANK
61.9%
COLLEGE, UNDER 1 YEAR
0.8/ 100
METRIC RATING
247th/ 347
METRIC RANK
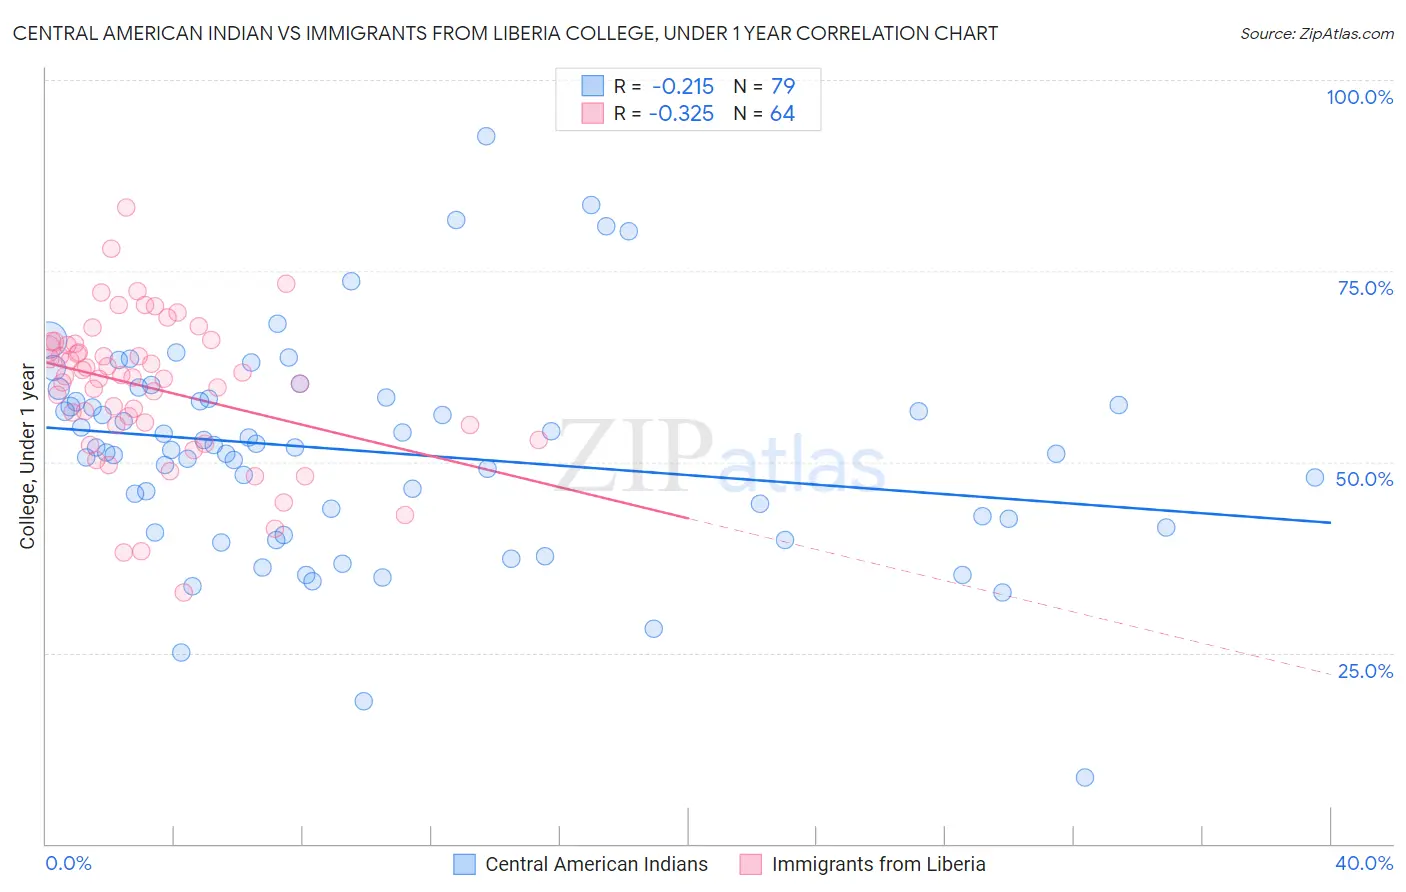
Central American Indian vs Immigrants from Liberia College, Under 1 year Correlation Chart
The statistical analysis conducted on geographies consisting of 326,142,761 people shows a weak negative correlation between the proportion of Central American Indians and percentage of population with at least college, under 1 year education in the United States with a correlation coefficient (R) of -0.215 and weighted average of 59.0%. Similarly, the statistical analysis conducted on geographies consisting of 135,295,665 people shows a mild negative correlation between the proportion of Immigrants from Liberia and percentage of population with at least college, under 1 year education in the United States with a correlation coefficient (R) of -0.325 and weighted average of 61.9%, a difference of 4.8%.
College, Under 1 year Correlation Summary
| Measurement | Central American Indian | Immigrants from Liberia |
| Minimum | 8.7% | 32.8% |
| Maximum | 92.6% | 83.3% |
| Range | 83.9% | 50.5% |
| Mean | 51.3% | 59.7% |
| Median | 51.8% | 61.1% |
| Interquartile 25% (IQ1) | 41.5% | 54.8% |
| Interquartile 75% (IQ3) | 58.2% | 65.4% |
| Interquartile Range (IQR) | 16.8% | 10.6% |
| Standard Deviation (Sample) | 14.2% | 9.6% |
| Standard Deviation (Population) | 14.1% | 9.5% |
Similar Demographics by College, Under 1 year
Demographics Similar to Central American Indians by College, Under 1 year
In terms of college, under 1 year, the demographic groups most similar to Central American Indians are Immigrants from Grenada (59.1%, a difference of 0.040%), Guyanese (59.0%, a difference of 0.040%), Immigrants from Belize (59.1%, a difference of 0.14%), Seminole (59.1%, a difference of 0.16%), and Nicaraguan (59.2%, a difference of 0.35%).
| Demographics | Rating | Rank | College, Under 1 year |
| Choctaw | 0.0 /100 | #289 | Tragic 59.3% |
| Ecuadorians | 0.0 /100 | #290 | Tragic 59.3% |
| Creek | 0.0 /100 | #291 | Tragic 59.3% |
| Nicaraguans | 0.0 /100 | #292 | Tragic 59.2% |
| Seminole | 0.0 /100 | #293 | Tragic 59.1% |
| Immigrants | Belize | 0.0 /100 | #294 | Tragic 59.1% |
| Immigrants | Grenada | 0.0 /100 | #295 | Tragic 59.1% |
| Central American Indians | 0.0 /100 | #296 | Tragic 59.0% |
| Guyanese | 0.0 /100 | #297 | Tragic 59.0% |
| Immigrants | Ecuador | 0.0 /100 | #298 | Tragic 58.7% |
| Cubans | 0.0 /100 | #299 | Tragic 58.6% |
| Immigrants | Guyana | 0.0 /100 | #300 | Tragic 58.5% |
| Mexican American Indians | 0.0 /100 | #301 | Tragic 58.1% |
| Apache | 0.0 /100 | #302 | Tragic 58.0% |
| Immigrants | Dominica | 0.0 /100 | #303 | Tragic 57.9% |
Demographics Similar to Immigrants from Liberia by College, Under 1 year
In terms of college, under 1 year, the demographic groups most similar to Immigrants from Liberia are Marshallese (61.9%, a difference of 0.020%), Potawatomi (61.8%, a difference of 0.23%), Delaware (62.1%, a difference of 0.25%), Colville (62.1%, a difference of 0.31%), and Hawaiian (62.1%, a difference of 0.40%).
| Demographics | Rating | Rank | College, Under 1 year |
| Aleuts | 1.1 /100 | #240 | Tragic 62.2% |
| Ottawa | 1.1 /100 | #241 | Tragic 62.2% |
| Malaysians | 1.1 /100 | #242 | Tragic 62.2% |
| Hawaiians | 1.1 /100 | #243 | Tragic 62.1% |
| Colville | 1.0 /100 | #244 | Tragic 62.1% |
| Delaware | 0.9 /100 | #245 | Tragic 62.1% |
| Marshallese | 0.8 /100 | #246 | Tragic 61.9% |
| Immigrants | Liberia | 0.8 /100 | #247 | Tragic 61.9% |
| Potawatomi | 0.6 /100 | #248 | Tragic 61.8% |
| Vietnamese | 0.5 /100 | #249 | Tragic 61.7% |
| Immigrants | Congo | 0.5 /100 | #250 | Tragic 61.7% |
| Immigrants | Micronesia | 0.5 /100 | #251 | Tragic 61.5% |
| West Indians | 0.4 /100 | #252 | Tragic 61.5% |
| Japanese | 0.4 /100 | #253 | Tragic 61.5% |
| Immigrants | Cambodia | 0.4 /100 | #254 | Tragic 61.5% |