Immigrants from Belarus vs Peruvian 8th Grade
COMPARE
Immigrants from Belarus
Peruvian
8th Grade
8th Grade Comparison
Immigrants from Belarus
Peruvians
96.0%
8TH GRADE
84.8/ 100
METRIC RATING
144th/ 347
METRIC RANK
94.7%
8TH GRADE
0.1/ 100
METRIC RATING
276th/ 347
METRIC RANK
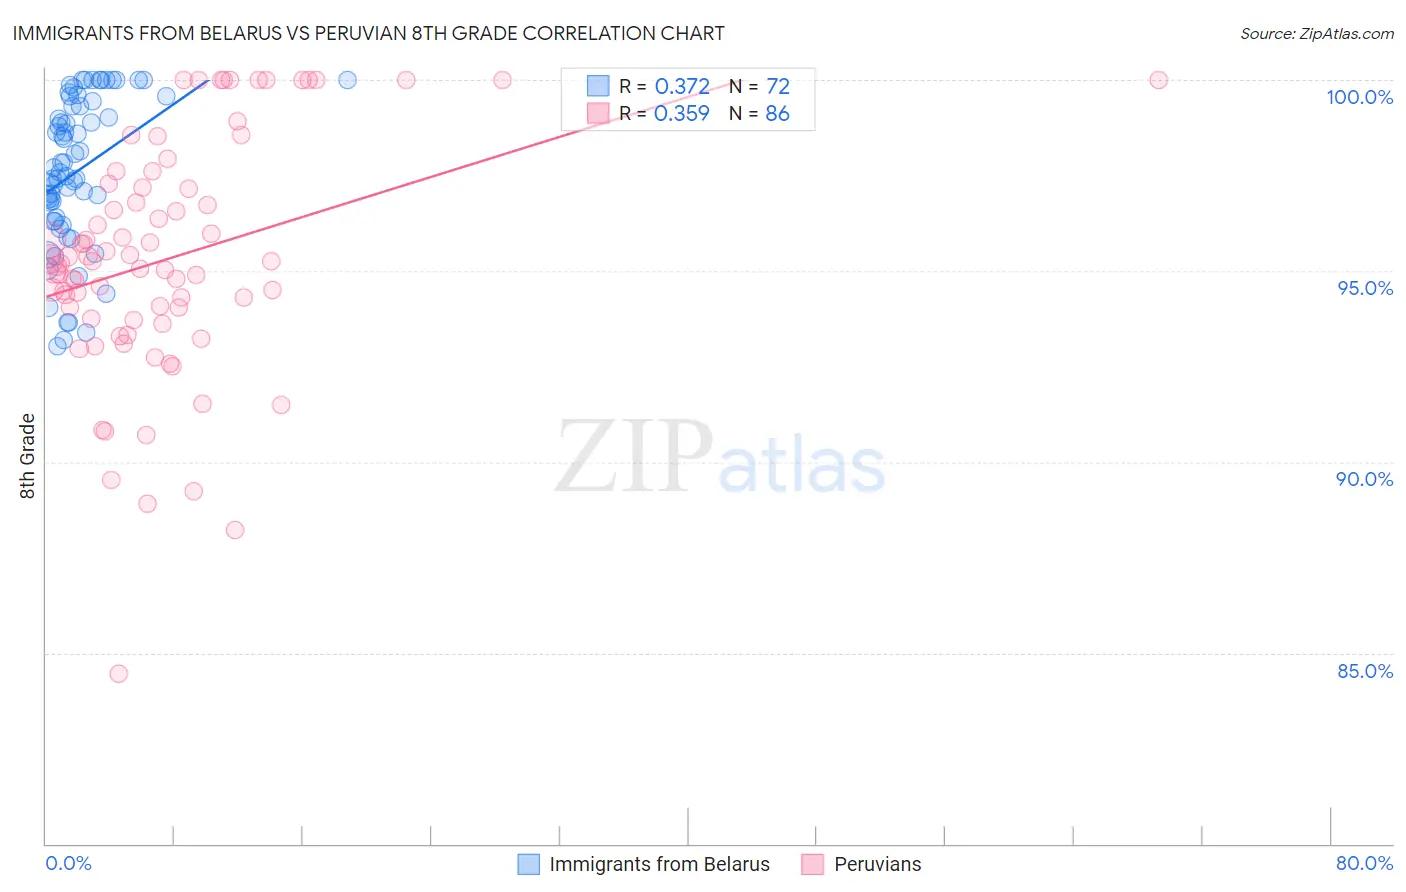
Immigrants from Belarus vs Peruvian 8th Grade Correlation Chart
The statistical analysis conducted on geographies consisting of 149,993,317 people shows a mild positive correlation between the proportion of Immigrants from Belarus and percentage of population with at least 8th grade education in the United States with a correlation coefficient (R) of 0.372 and weighted average of 96.0%. Similarly, the statistical analysis conducted on geographies consisting of 363,251,075 people shows a mild positive correlation between the proportion of Peruvians and percentage of population with at least 8th grade education in the United States with a correlation coefficient (R) of 0.359 and weighted average of 94.7%, a difference of 1.4%.
8th Grade Correlation Summary
| Measurement | Immigrants from Belarus | Peruvian |
| Minimum | 93.0% | 84.4% |
| Maximum | 100.0% | 100.0% |
| Range | 7.0% | 15.6% |
| Mean | 97.6% | 95.3% |
| Median | 97.6% | 95.2% |
| Interquartile 25% (IQ1) | 96.3% | 93.8% |
| Interquartile 75% (IQ3) | 99.4% | 97.2% |
| Interquartile Range (IQR) | 3.0% | 3.4% |
| Standard Deviation (Sample) | 2.0% | 3.1% |
| Standard Deviation (Population) | 2.0% | 3.1% |
Similar Demographics by 8th Grade
Demographics Similar to Immigrants from Belarus by 8th Grade
In terms of 8th grade, the demographic groups most similar to Immigrants from Belarus are Spanish (96.0%, a difference of 0.0%), Immigrants from Greece (96.0%, a difference of 0.010%), Immigrants from Eastern Europe (96.0%, a difference of 0.010%), Lumbee (96.0%, a difference of 0.010%), and Israeli (96.0%, a difference of 0.010%).
| Demographics | Rating | Rank | 8th Grade |
| Cambodians | 90.6 /100 | #137 | Exceptional 96.1% |
| Burmese | 90.2 /100 | #138 | Exceptional 96.1% |
| Hmong | 89.7 /100 | #139 | Excellent 96.1% |
| Immigrants | South Central Asia | 89.4 /100 | #140 | Excellent 96.1% |
| Immigrants | Greece | 85.9 /100 | #141 | Excellent 96.0% |
| Immigrants | Eastern Europe | 85.4 /100 | #142 | Excellent 96.0% |
| Spanish | 85.1 /100 | #143 | Excellent 96.0% |
| Immigrants | Belarus | 84.8 /100 | #144 | Excellent 96.0% |
| Lumbee | 84.1 /100 | #145 | Excellent 96.0% |
| Israelis | 84.1 /100 | #146 | Excellent 96.0% |
| Colville | 84.0 /100 | #147 | Excellent 96.0% |
| Albanians | 83.1 /100 | #148 | Excellent 96.0% |
| Immigrants | Israel | 81.3 /100 | #149 | Excellent 96.0% |
| Immigrants | Russia | 80.9 /100 | #150 | Excellent 96.0% |
| Blackfeet | 80.8 /100 | #151 | Excellent 96.0% |
Demographics Similar to Peruvians by 8th Grade
In terms of 8th grade, the demographic groups most similar to Peruvians are Immigrants from Colombia (94.7%, a difference of 0.030%), Taiwanese (94.7%, a difference of 0.030%), Trinidadian and Tobagonian (94.7%, a difference of 0.040%), Immigrants from Western Africa (94.8%, a difference of 0.050%), and Immigrants from South America (94.8%, a difference of 0.060%).
| Demographics | Rating | Rank | 8th Grade |
| Immigrants | Thailand | 0.2 /100 | #269 | Tragic 94.8% |
| Immigrants | Uzbekistan | 0.2 /100 | #270 | Tragic 94.8% |
| Immigrants | Afghanistan | 0.2 /100 | #271 | Tragic 94.8% |
| Immigrants | South America | 0.2 /100 | #272 | Tragic 94.8% |
| Immigrants | Western Africa | 0.2 /100 | #273 | Tragic 94.8% |
| Trinidadians and Tobagonians | 0.2 /100 | #274 | Tragic 94.7% |
| Immigrants | Colombia | 0.2 /100 | #275 | Tragic 94.7% |
| Peruvians | 0.1 /100 | #276 | Tragic 94.7% |
| Taiwanese | 0.1 /100 | #277 | Tragic 94.7% |
| Armenians | 0.1 /100 | #278 | Tragic 94.7% |
| Immigrants | Trinidad and Tobago | 0.1 /100 | #279 | Tragic 94.6% |
| Barbadians | 0.1 /100 | #280 | Tragic 94.6% |
| Immigrants | Bolivia | 0.1 /100 | #281 | Tragic 94.6% |
| Immigrants | Eritrea | 0.1 /100 | #282 | Tragic 94.6% |
| Immigrants | St. Vincent and the Grenadines | 0.1 /100 | #283 | Tragic 94.6% |