Immigrants from West Indies vs Peruvian 8th Grade
COMPARE
Immigrants from West Indies
Peruvian
8th Grade
8th Grade Comparison
Immigrants from West Indies
Peruvians
94.3%
8TH GRADE
0.0/ 100
METRIC RATING
290th/ 347
METRIC RANK
94.7%
8TH GRADE
0.1/ 100
METRIC RATING
276th/ 347
METRIC RANK
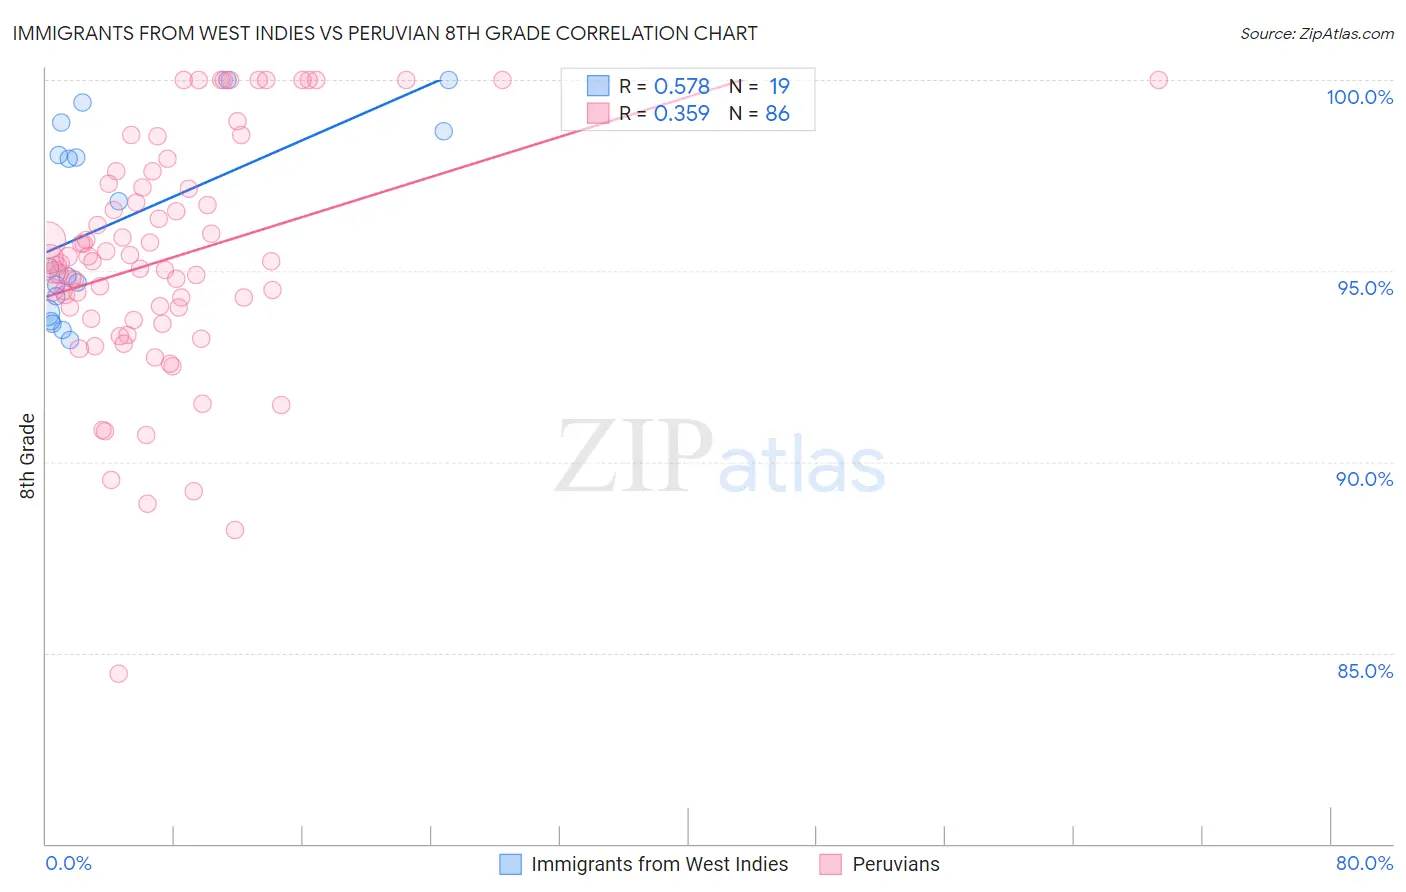
Immigrants from West Indies vs Peruvian 8th Grade Correlation Chart
The statistical analysis conducted on geographies consisting of 72,457,514 people shows a substantial positive correlation between the proportion of Immigrants from West Indies and percentage of population with at least 8th grade education in the United States with a correlation coefficient (R) of 0.578 and weighted average of 94.3%. Similarly, the statistical analysis conducted on geographies consisting of 363,251,075 people shows a mild positive correlation between the proportion of Peruvians and percentage of population with at least 8th grade education in the United States with a correlation coefficient (R) of 0.359 and weighted average of 94.7%, a difference of 0.40%.
8th Grade Correlation Summary
| Measurement | Immigrants from West Indies | Peruvian |
| Minimum | 93.2% | 84.4% |
| Maximum | 100.0% | 100.0% |
| Range | 6.8% | 15.6% |
| Mean | 96.3% | 95.3% |
| Median | 95.1% | 95.2% |
| Interquartile 25% (IQ1) | 93.9% | 93.8% |
| Interquartile 75% (IQ3) | 98.7% | 97.2% |
| Interquartile Range (IQR) | 4.8% | 3.4% |
| Standard Deviation (Sample) | 2.5% | 3.1% |
| Standard Deviation (Population) | 2.4% | 3.1% |
Demographics Similar to Immigrants from West Indies and Peruvians by 8th Grade
In terms of 8th grade, the demographic groups most similar to Immigrants from West Indies are Immigrants from Grenada (94.3%, a difference of 0.010%), British West Indian (94.4%, a difference of 0.070%), Bangladeshi (94.3%, a difference of 0.080%), Yaqui (94.2%, a difference of 0.11%), and Malaysian (94.5%, a difference of 0.13%). Similarly, the demographic groups most similar to Peruvians are Immigrants from Colombia (94.7%, a difference of 0.030%), Taiwanese (94.7%, a difference of 0.030%), Trinidadian and Tobagonian (94.7%, a difference of 0.040%), Immigrants from Western Africa (94.8%, a difference of 0.050%), and Armenian (94.7%, a difference of 0.060%).
| Demographics | Rating | Rank | 8th Grade |
| Immigrants | Western Africa | 0.2 /100 | #273 | Tragic 94.8% |
| Trinidadians and Tobagonians | 0.2 /100 | #274 | Tragic 94.7% |
| Immigrants | Colombia | 0.2 /100 | #275 | Tragic 94.7% |
| Peruvians | 0.1 /100 | #276 | Tragic 94.7% |
| Taiwanese | 0.1 /100 | #277 | Tragic 94.7% |
| Armenians | 0.1 /100 | #278 | Tragic 94.7% |
| Immigrants | Trinidad and Tobago | 0.1 /100 | #279 | Tragic 94.6% |
| Barbadians | 0.1 /100 | #280 | Tragic 94.6% |
| Immigrants | Bolivia | 0.1 /100 | #281 | Tragic 94.6% |
| Immigrants | Eritrea | 0.1 /100 | #282 | Tragic 94.6% |
| Immigrants | St. Vincent and the Grenadines | 0.1 /100 | #283 | Tragic 94.6% |
| Immigrants | Philippines | 0.1 /100 | #284 | Tragic 94.6% |
| Immigrants | Barbados | 0.0 /100 | #285 | Tragic 94.5% |
| Immigrants | Peru | 0.0 /100 | #286 | Tragic 94.5% |
| Tohono O'odham | 0.0 /100 | #287 | Tragic 94.5% |
| Malaysians | 0.0 /100 | #288 | Tragic 94.5% |
| British West Indians | 0.0 /100 | #289 | Tragic 94.4% |
| Immigrants | West Indies | 0.0 /100 | #290 | Tragic 94.3% |
| Immigrants | Grenada | 0.0 /100 | #291 | Tragic 94.3% |
| Bangladeshis | 0.0 /100 | #292 | Tragic 94.3% |
| Yaqui | 0.0 /100 | #293 | Tragic 94.2% |