Immigrants from Ecuador vs Peruvian 8th Grade
COMPARE
Immigrants from Ecuador
Peruvian
8th Grade
8th Grade Comparison
Immigrants from Ecuador
Peruvians
93.3%
8TH GRADE
0.0/ 100
METRIC RATING
317th/ 347
METRIC RANK
94.7%
8TH GRADE
0.1/ 100
METRIC RATING
276th/ 347
METRIC RANK
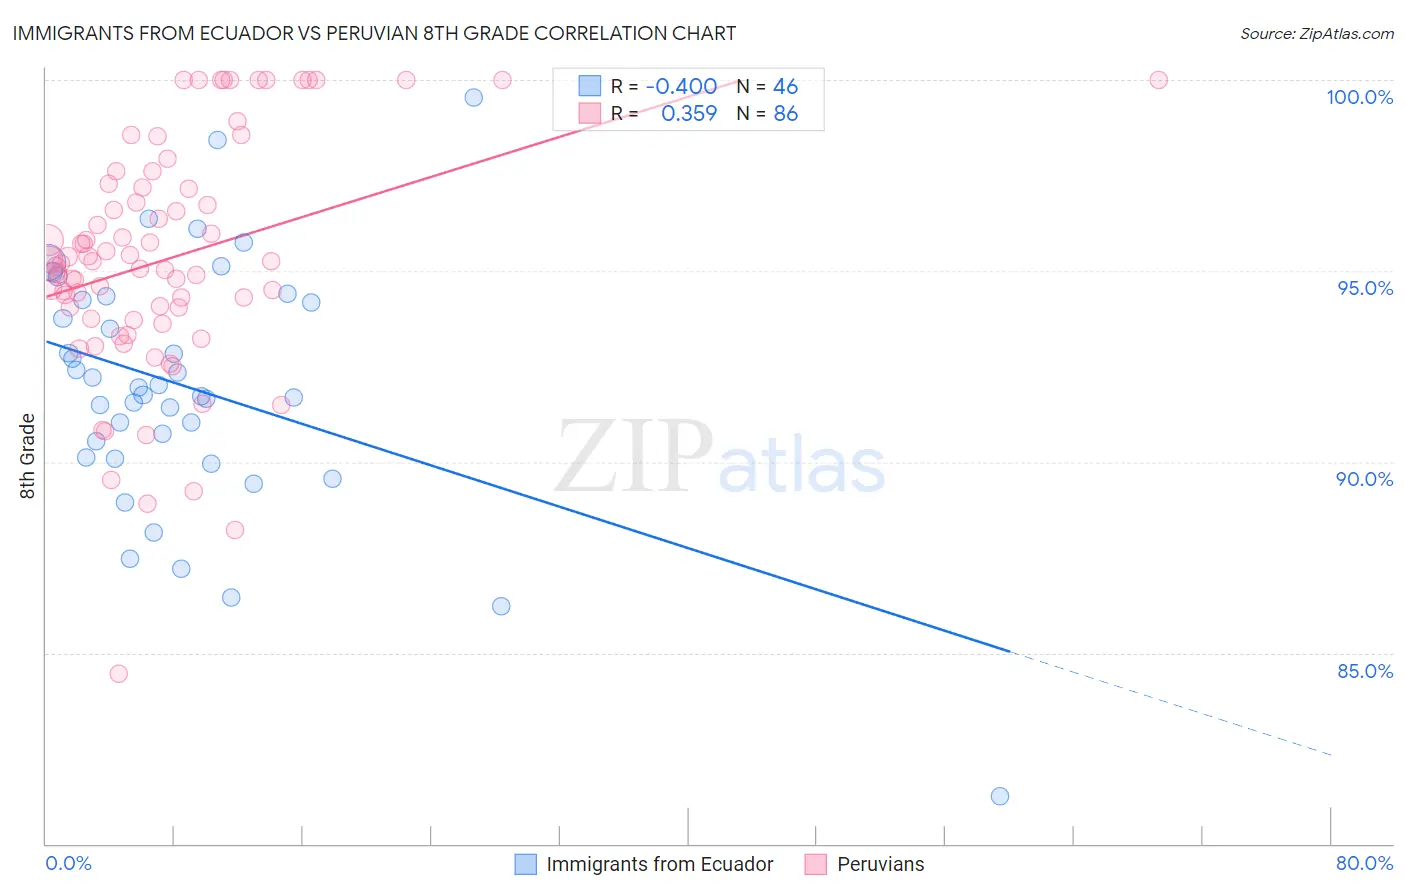
Immigrants from Ecuador vs Peruvian 8th Grade Correlation Chart
The statistical analysis conducted on geographies consisting of 270,907,929 people shows a moderate negative correlation between the proportion of Immigrants from Ecuador and percentage of population with at least 8th grade education in the United States with a correlation coefficient (R) of -0.400 and weighted average of 93.3%. Similarly, the statistical analysis conducted on geographies consisting of 363,251,075 people shows a mild positive correlation between the proportion of Peruvians and percentage of population with at least 8th grade education in the United States with a correlation coefficient (R) of 0.359 and weighted average of 94.7%, a difference of 1.6%.
8th Grade Correlation Summary
| Measurement | Immigrants from Ecuador | Peruvian |
| Minimum | 81.2% | 84.4% |
| Maximum | 99.5% | 100.0% |
| Range | 18.3% | 15.6% |
| Mean | 91.9% | 95.3% |
| Median | 91.9% | 95.2% |
| Interquartile 25% (IQ1) | 90.1% | 93.8% |
| Interquartile 75% (IQ3) | 94.2% | 97.2% |
| Interquartile Range (IQR) | 4.1% | 3.4% |
| Standard Deviation (Sample) | 3.3% | 3.1% |
| Standard Deviation (Population) | 3.3% | 3.1% |
Similar Demographics by 8th Grade
Demographics Similar to Immigrants from Ecuador by 8th Grade
In terms of 8th grade, the demographic groups most similar to Immigrants from Ecuador are Puerto Rican (93.2%, a difference of 0.010%), Immigrants from Cuba (93.2%, a difference of 0.040%), Immigrants from Cambodia (93.3%, a difference of 0.060%), Immigrants from Fiji (93.2%, a difference of 0.070%), and Belizean (93.1%, a difference of 0.20%).
| Demographics | Rating | Rank | 8th Grade |
| Japanese | 0.0 /100 | #310 | Tragic 93.6% |
| Immigrants | Bangladesh | 0.0 /100 | #311 | Tragic 93.6% |
| Cape Verdeans | 0.0 /100 | #312 | Tragic 93.5% |
| Immigrants | Caribbean | 0.0 /100 | #313 | Tragic 93.5% |
| Immigrants | Vietnam | 0.0 /100 | #314 | Tragic 93.5% |
| Vietnamese | 0.0 /100 | #315 | Tragic 93.5% |
| Immigrants | Cambodia | 0.0 /100 | #316 | Tragic 93.3% |
| Immigrants | Ecuador | 0.0 /100 | #317 | Tragic 93.3% |
| Puerto Ricans | 0.0 /100 | #318 | Tragic 93.2% |
| Immigrants | Cuba | 0.0 /100 | #319 | Tragic 93.2% |
| Immigrants | Fiji | 0.0 /100 | #320 | Tragic 93.2% |
| Belizeans | 0.0 /100 | #321 | Tragic 93.1% |
| Nicaraguans | 0.0 /100 | #322 | Tragic 93.0% |
| Immigrants | Belize | 0.0 /100 | #323 | Tragic 92.9% |
| Nepalese | 0.0 /100 | #324 | Tragic 92.8% |
Demographics Similar to Peruvians by 8th Grade
In terms of 8th grade, the demographic groups most similar to Peruvians are Immigrants from Colombia (94.7%, a difference of 0.030%), Taiwanese (94.7%, a difference of 0.030%), Trinidadian and Tobagonian (94.7%, a difference of 0.040%), Immigrants from Western Africa (94.8%, a difference of 0.050%), and Immigrants from South America (94.8%, a difference of 0.060%).
| Demographics | Rating | Rank | 8th Grade |
| Immigrants | Thailand | 0.2 /100 | #269 | Tragic 94.8% |
| Immigrants | Uzbekistan | 0.2 /100 | #270 | Tragic 94.8% |
| Immigrants | Afghanistan | 0.2 /100 | #271 | Tragic 94.8% |
| Immigrants | South America | 0.2 /100 | #272 | Tragic 94.8% |
| Immigrants | Western Africa | 0.2 /100 | #273 | Tragic 94.8% |
| Trinidadians and Tobagonians | 0.2 /100 | #274 | Tragic 94.7% |
| Immigrants | Colombia | 0.2 /100 | #275 | Tragic 94.7% |
| Peruvians | 0.1 /100 | #276 | Tragic 94.7% |
| Taiwanese | 0.1 /100 | #277 | Tragic 94.7% |
| Armenians | 0.1 /100 | #278 | Tragic 94.7% |
| Immigrants | Trinidad and Tobago | 0.1 /100 | #279 | Tragic 94.6% |
| Barbadians | 0.1 /100 | #280 | Tragic 94.6% |
| Immigrants | Bolivia | 0.1 /100 | #281 | Tragic 94.6% |
| Immigrants | Eritrea | 0.1 /100 | #282 | Tragic 94.6% |
| Immigrants | St. Vincent and the Grenadines | 0.1 /100 | #283 | Tragic 94.6% |