Immigrants from Belarus vs Iraqi 8th Grade
COMPARE
Immigrants from Belarus
Iraqi
8th Grade
8th Grade Comparison
Immigrants from Belarus
Iraqis
96.0%
8TH GRADE
84.8/ 100
METRIC RATING
144th/ 347
METRIC RANK
95.7%
8TH GRADE
40.5/ 100
METRIC RATING
180th/ 347
METRIC RANK
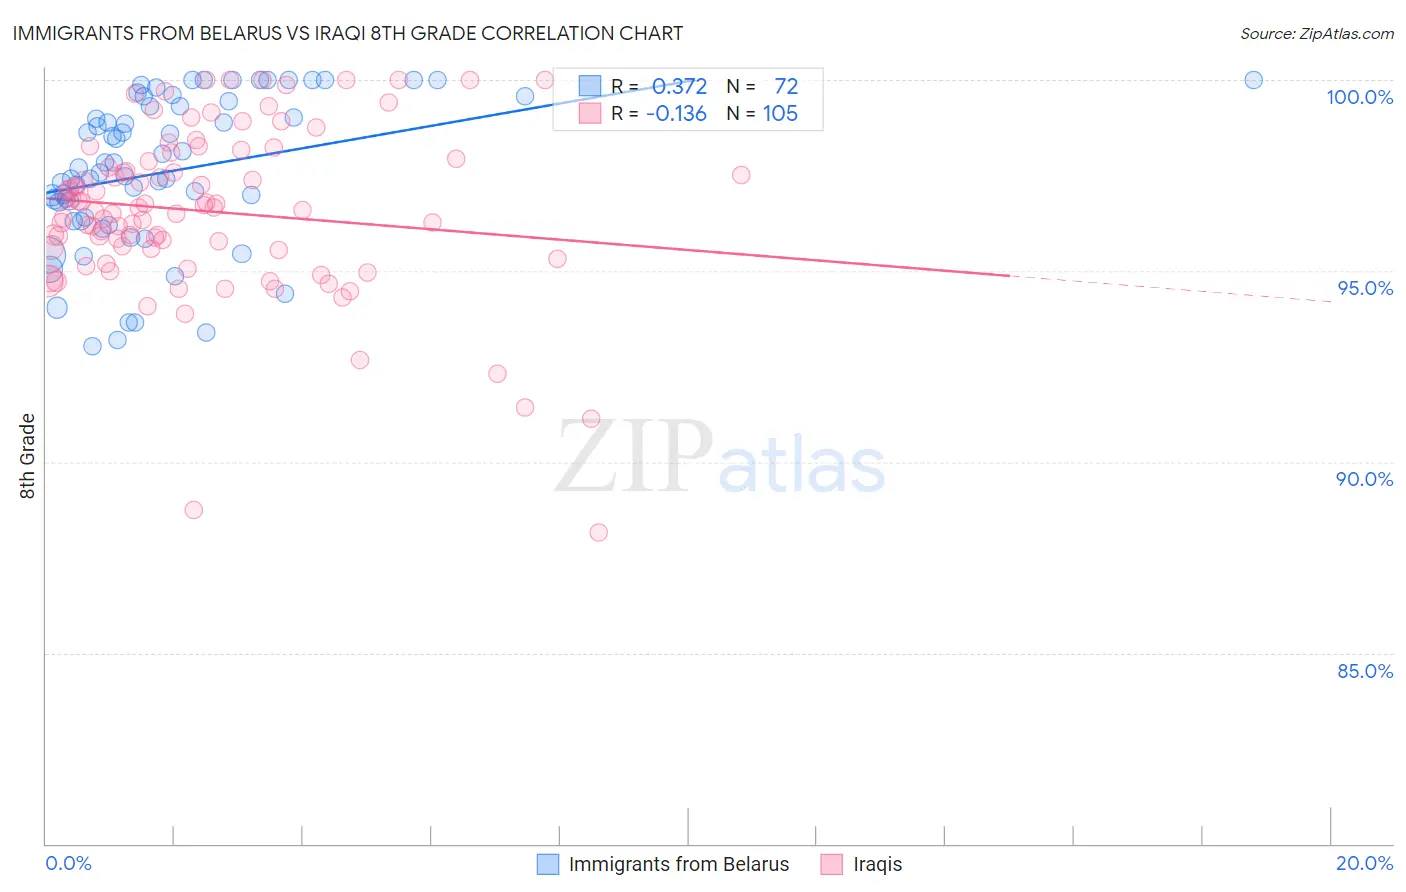
Immigrants from Belarus vs Iraqi 8th Grade Correlation Chart
The statistical analysis conducted on geographies consisting of 149,993,317 people shows a mild positive correlation between the proportion of Immigrants from Belarus and percentage of population with at least 8th grade education in the United States with a correlation coefficient (R) of 0.372 and weighted average of 96.0%. Similarly, the statistical analysis conducted on geographies consisting of 170,614,457 people shows a poor negative correlation between the proportion of Iraqis and percentage of population with at least 8th grade education in the United States with a correlation coefficient (R) of -0.136 and weighted average of 95.7%, a difference of 0.34%.
8th Grade Correlation Summary
| Measurement | Immigrants from Belarus | Iraqi |
| Minimum | 93.0% | 88.2% |
| Maximum | 100.0% | 100.0% |
| Range | 7.0% | 11.8% |
| Mean | 97.6% | 96.6% |
| Median | 97.6% | 96.7% |
| Interquartile 25% (IQ1) | 96.3% | 95.6% |
| Interquartile 75% (IQ3) | 99.4% | 97.9% |
| Interquartile Range (IQR) | 3.0% | 2.3% |
| Standard Deviation (Sample) | 2.0% | 2.2% |
| Standard Deviation (Population) | 2.0% | 2.2% |
Similar Demographics by 8th Grade
Demographics Similar to Immigrants from Belarus by 8th Grade
In terms of 8th grade, the demographic groups most similar to Immigrants from Belarus are Spanish (96.0%, a difference of 0.0%), Immigrants from Greece (96.0%, a difference of 0.010%), Immigrants from Eastern Europe (96.0%, a difference of 0.010%), Lumbee (96.0%, a difference of 0.010%), and Israeli (96.0%, a difference of 0.010%).
| Demographics | Rating | Rank | 8th Grade |
| Cambodians | 90.6 /100 | #137 | Exceptional 96.1% |
| Burmese | 90.2 /100 | #138 | Exceptional 96.1% |
| Hmong | 89.7 /100 | #139 | Excellent 96.1% |
| Immigrants | South Central Asia | 89.4 /100 | #140 | Excellent 96.1% |
| Immigrants | Greece | 85.9 /100 | #141 | Excellent 96.0% |
| Immigrants | Eastern Europe | 85.4 /100 | #142 | Excellent 96.0% |
| Spanish | 85.1 /100 | #143 | Excellent 96.0% |
| Immigrants | Belarus | 84.8 /100 | #144 | Excellent 96.0% |
| Lumbee | 84.1 /100 | #145 | Excellent 96.0% |
| Israelis | 84.1 /100 | #146 | Excellent 96.0% |
| Colville | 84.0 /100 | #147 | Excellent 96.0% |
| Albanians | 83.1 /100 | #148 | Excellent 96.0% |
| Immigrants | Israel | 81.3 /100 | #149 | Excellent 96.0% |
| Immigrants | Russia | 80.9 /100 | #150 | Excellent 96.0% |
| Blackfeet | 80.8 /100 | #151 | Excellent 96.0% |
Demographics Similar to Iraqis by 8th Grade
In terms of 8th grade, the demographic groups most similar to Iraqis are Immigrants from Spain (95.7%, a difference of 0.010%), Immigrants from Egypt (95.7%, a difference of 0.020%), Immigrants from Brazil (95.7%, a difference of 0.030%), Immigrants from Iraq (95.6%, a difference of 0.030%), and Immigrants from Uganda (95.6%, a difference of 0.030%).
| Demographics | Rating | Rank | 8th Grade |
| Mongolians | 53.0 /100 | #173 | Average 95.8% |
| Chileans | 50.0 /100 | #174 | Average 95.7% |
| Immigrants | Albania | 49.6 /100 | #175 | Average 95.7% |
| Pakistanis | 48.8 /100 | #176 | Average 95.7% |
| Marshallese | 47.6 /100 | #177 | Average 95.7% |
| Venezuelans | 47.5 /100 | #178 | Average 95.7% |
| Immigrants | Brazil | 45.4 /100 | #179 | Average 95.7% |
| Iraqis | 40.5 /100 | #180 | Average 95.7% |
| Immigrants | Spain | 38.7 /100 | #181 | Fair 95.7% |
| Immigrants | Egypt | 37.9 /100 | #182 | Fair 95.7% |
| Immigrants | Iraq | 36.2 /100 | #183 | Fair 95.6% |
| Immigrants | Uganda | 36.0 /100 | #184 | Fair 95.6% |
| Blacks/African Americans | 34.8 /100 | #185 | Fair 95.6% |
| Brazilians | 34.8 /100 | #186 | Fair 95.6% |
| Sudanese | 33.0 /100 | #187 | Fair 95.6% |