Immigrants from Belarus vs Bahamian 8th Grade
COMPARE
Immigrants from Belarus
Bahamian
8th Grade
8th Grade Comparison
Immigrants from Belarus
Bahamians
96.0%
8TH GRADE
84.8/ 100
METRIC RATING
144th/ 347
METRIC RANK
95.3%
8TH GRADE
5.6/ 100
METRIC RATING
227th/ 347
METRIC RANK
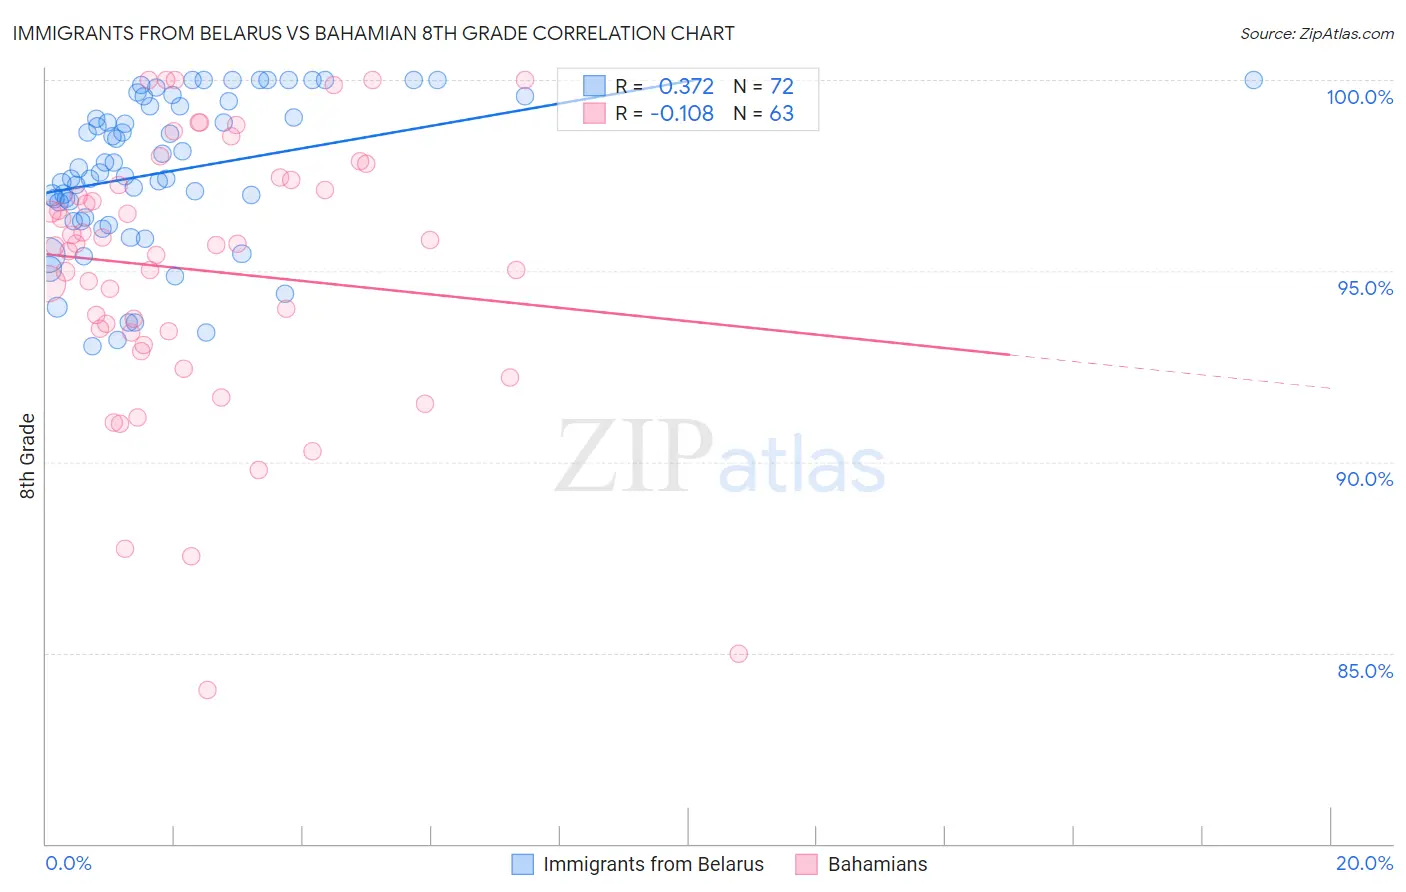
Immigrants from Belarus vs Bahamian 8th Grade Correlation Chart
The statistical analysis conducted on geographies consisting of 149,993,317 people shows a mild positive correlation between the proportion of Immigrants from Belarus and percentage of population with at least 8th grade education in the United States with a correlation coefficient (R) of 0.372 and weighted average of 96.0%. Similarly, the statistical analysis conducted on geographies consisting of 112,698,819 people shows a poor negative correlation between the proportion of Bahamians and percentage of population with at least 8th grade education in the United States with a correlation coefficient (R) of -0.108 and weighted average of 95.3%, a difference of 0.74%.
8th Grade Correlation Summary
| Measurement | Immigrants from Belarus | Bahamian |
| Minimum | 93.0% | 84.0% |
| Maximum | 100.0% | 100.0% |
| Range | 7.0% | 16.0% |
| Mean | 97.6% | 95.0% |
| Median | 97.6% | 95.7% |
| Interquartile 25% (IQ1) | 96.3% | 93.4% |
| Interquartile 75% (IQ3) | 99.4% | 97.4% |
| Interquartile Range (IQR) | 3.0% | 4.0% |
| Standard Deviation (Sample) | 2.0% | 3.5% |
| Standard Deviation (Population) | 2.0% | 3.5% |
Similar Demographics by 8th Grade
Demographics Similar to Immigrants from Belarus by 8th Grade
In terms of 8th grade, the demographic groups most similar to Immigrants from Belarus are Spanish (96.0%, a difference of 0.0%), Immigrants from Greece (96.0%, a difference of 0.010%), Immigrants from Eastern Europe (96.0%, a difference of 0.010%), Lumbee (96.0%, a difference of 0.010%), and Israeli (96.0%, a difference of 0.010%).
| Demographics | Rating | Rank | 8th Grade |
| Cambodians | 90.6 /100 | #137 | Exceptional 96.1% |
| Burmese | 90.2 /100 | #138 | Exceptional 96.1% |
| Hmong | 89.7 /100 | #139 | Excellent 96.1% |
| Immigrants | South Central Asia | 89.4 /100 | #140 | Excellent 96.1% |
| Immigrants | Greece | 85.9 /100 | #141 | Excellent 96.0% |
| Immigrants | Eastern Europe | 85.4 /100 | #142 | Excellent 96.0% |
| Spanish | 85.1 /100 | #143 | Excellent 96.0% |
| Immigrants | Belarus | 84.8 /100 | #144 | Excellent 96.0% |
| Lumbee | 84.1 /100 | #145 | Excellent 96.0% |
| Israelis | 84.1 /100 | #146 | Excellent 96.0% |
| Colville | 84.0 /100 | #147 | Excellent 96.0% |
| Albanians | 83.1 /100 | #148 | Excellent 96.0% |
| Immigrants | Israel | 81.3 /100 | #149 | Excellent 96.0% |
| Immigrants | Russia | 80.9 /100 | #150 | Excellent 96.0% |
| Blackfeet | 80.8 /100 | #151 | Excellent 96.0% |
Demographics Similar to Bahamians by 8th Grade
In terms of 8th grade, the demographic groups most similar to Bahamians are Navajo (95.3%, a difference of 0.0%), Immigrants from Eastern Africa (95.3%, a difference of 0.0%), Immigrants from Western Asia (95.3%, a difference of 0.010%), Subsaharan African (95.3%, a difference of 0.010%), and Immigrants from Oceania (95.3%, a difference of 0.040%).
| Demographics | Rating | Rank | 8th Grade |
| Immigrants | Southern Europe | 7.7 /100 | #220 | Tragic 95.3% |
| Immigrants | Syria | 7.4 /100 | #221 | Tragic 95.3% |
| Immigrants | Malaysia | 7.3 /100 | #222 | Tragic 95.3% |
| Immigrants | Oceania | 7.1 /100 | #223 | Tragic 95.3% |
| Immigrants | Western Asia | 6.0 /100 | #224 | Tragic 95.3% |
| Sub-Saharan Africans | 6.0 /100 | #225 | Tragic 95.3% |
| Navajo | 5.7 /100 | #226 | Tragic 95.3% |
| Bahamians | 5.6 /100 | #227 | Tragic 95.3% |
| Immigrants | Eastern Africa | 5.6 /100 | #228 | Tragic 95.3% |
| Immigrants | Indonesia | 4.4 /100 | #229 | Tragic 95.3% |
| Immigrants | Panama | 4.1 /100 | #230 | Tragic 95.2% |
| Asians | 3.5 /100 | #231 | Tragic 95.2% |
| Indians (Asian) | 3.3 /100 | #232 | Tragic 95.2% |
| Immigrants | Asia | 3.1 /100 | #233 | Tragic 95.2% |
| Costa Ricans | 3.0 /100 | #234 | Tragic 95.2% |