Immigrants from Belarus vs Pakistani College, Under 1 year
COMPARE
Immigrants from Belarus
Pakistani
College, Under 1 year
College, Under 1 year Comparison
Immigrants from Belarus
Pakistanis
69.2%
COLLEGE, UNDER 1 YEAR
99.5/ 100
METRIC RATING
62nd/ 347
METRIC RANK
67.5%
COLLEGE, UNDER 1 YEAR
94.8/ 100
METRIC RATING
117th/ 347
METRIC RANK
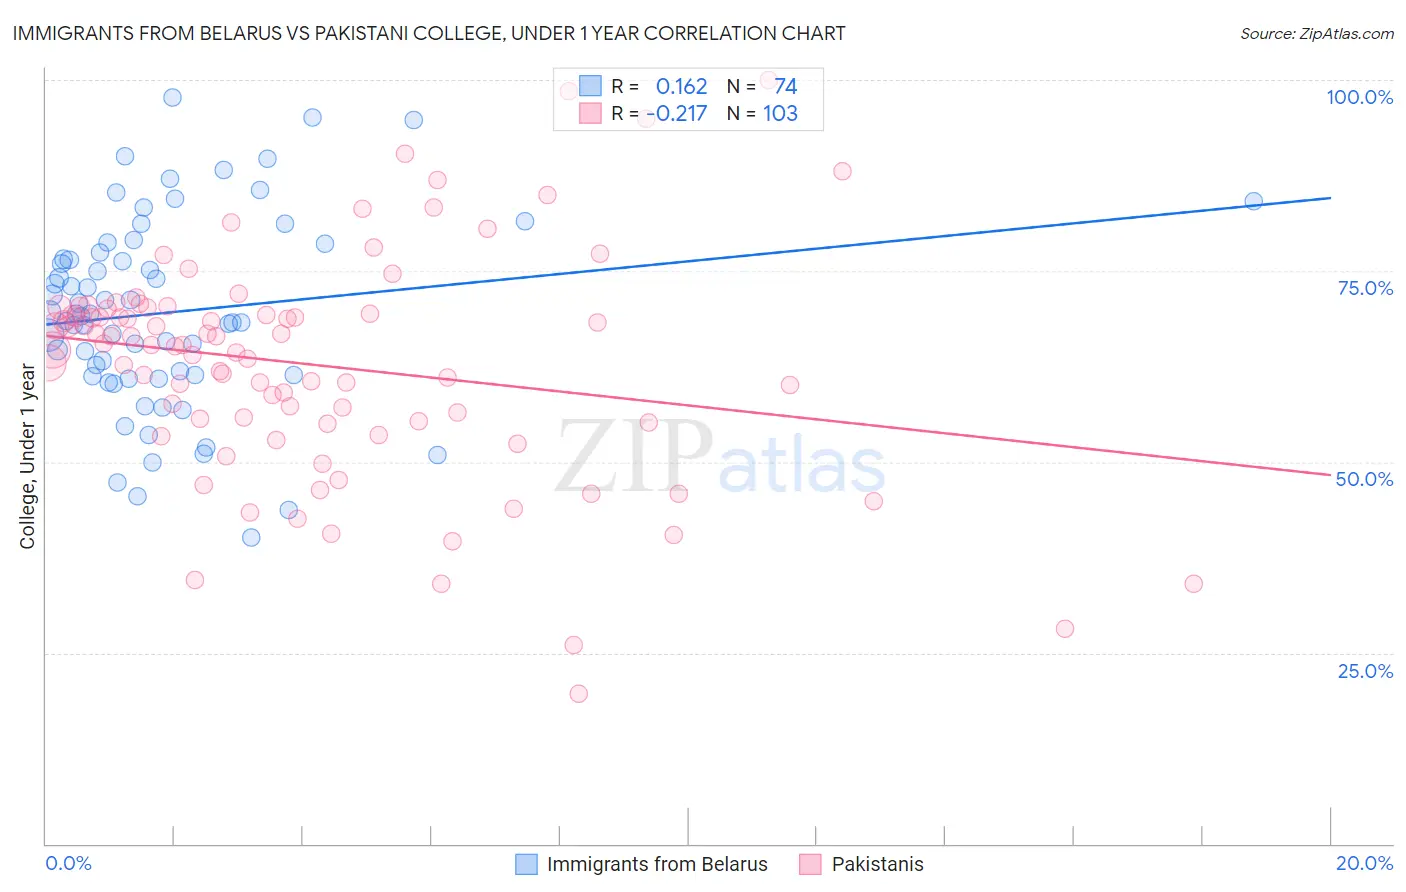
Immigrants from Belarus vs Pakistani College, Under 1 year Correlation Chart
The statistical analysis conducted on geographies consisting of 150,205,158 people shows a poor positive correlation between the proportion of Immigrants from Belarus and percentage of population with at least college, under 1 year education in the United States with a correlation coefficient (R) of 0.162 and weighted average of 69.2%. Similarly, the statistical analysis conducted on geographies consisting of 335,356,650 people shows a weak negative correlation between the proportion of Pakistanis and percentage of population with at least college, under 1 year education in the United States with a correlation coefficient (R) of -0.217 and weighted average of 67.5%, a difference of 2.5%.
College, Under 1 year Correlation Summary
| Measurement | Immigrants from Belarus | Pakistani |
| Minimum | 40.0% | 19.6% |
| Maximum | 97.7% | 100.0% |
| Range | 57.6% | 80.4% |
| Mean | 69.6% | 62.7% |
| Median | 69.2% | 65.2% |
| Interquartile 25% (IQ1) | 61.3% | 55.2% |
| Interquartile 75% (IQ3) | 77.5% | 70.0% |
| Interquartile Range (IQR) | 16.2% | 14.8% |
| Standard Deviation (Sample) | 12.6% | 14.8% |
| Standard Deviation (Population) | 12.5% | 14.7% |
Similar Demographics by College, Under 1 year
Demographics Similar to Immigrants from Belarus by College, Under 1 year
In terms of college, under 1 year, the demographic groups most similar to Immigrants from Belarus are Immigrants from Kazakhstan (69.2%, a difference of 0.0%), Immigrants from Asia (69.2%, a difference of 0.040%), Immigrants from Serbia (69.3%, a difference of 0.13%), Immigrants from Canada (69.1%, a difference of 0.13%), and Northern European (69.0%, a difference of 0.17%).
| Demographics | Rating | Rank | College, Under 1 year |
| Maltese | 99.7 /100 | #55 | Exceptional 69.5% |
| Immigrants | Scotland | 99.6 /100 | #56 | Exceptional 69.4% |
| Asians | 99.6 /100 | #57 | Exceptional 69.4% |
| Immigrants | Malaysia | 99.6 /100 | #58 | Exceptional 69.3% |
| Immigrants | Serbia | 99.5 /100 | #59 | Exceptional 69.3% |
| Immigrants | Asia | 99.5 /100 | #60 | Exceptional 69.2% |
| Immigrants | Kazakhstan | 99.5 /100 | #61 | Exceptional 69.2% |
| Immigrants | Belarus | 99.5 /100 | #62 | Exceptional 69.2% |
| Immigrants | Canada | 99.4 /100 | #63 | Exceptional 69.1% |
| Northern Europeans | 99.4 /100 | #64 | Exceptional 69.0% |
| Immigrants | Moldova | 99.3 /100 | #65 | Exceptional 69.0% |
| Immigrants | North America | 99.3 /100 | #66 | Exceptional 69.0% |
| Immigrants | Zimbabwe | 99.2 /100 | #67 | Exceptional 68.9% |
| Immigrants | Indonesia | 99.2 /100 | #68 | Exceptional 68.9% |
| Immigrants | Romania | 99.2 /100 | #69 | Exceptional 68.9% |
Demographics Similar to Pakistanis by College, Under 1 year
In terms of college, under 1 year, the demographic groups most similar to Pakistanis are Immigrants from Nepal (67.5%, a difference of 0.020%), Immigrants from Ukraine (67.5%, a difference of 0.030%), Lebanese (67.5%, a difference of 0.040%), Basque (67.6%, a difference of 0.10%), and Chilean (67.6%, a difference of 0.11%).
| Demographics | Rating | Rank | College, Under 1 year |
| Assyrians/Chaldeans/Syriacs | 95.8 /100 | #110 | Exceptional 67.7% |
| Ukrainians | 95.8 /100 | #111 | Exceptional 67.7% |
| Macedonians | 95.7 /100 | #112 | Exceptional 67.6% |
| Syrians | 95.6 /100 | #113 | Exceptional 67.6% |
| Chileans | 95.3 /100 | #114 | Exceptional 67.6% |
| Basques | 95.2 /100 | #115 | Exceptional 67.6% |
| Immigrants | Nepal | 94.9 /100 | #116 | Exceptional 67.5% |
| Pakistanis | 94.8 /100 | #117 | Exceptional 67.5% |
| Immigrants | Ukraine | 94.7 /100 | #118 | Exceptional 67.5% |
| Lebanese | 94.6 /100 | #119 | Exceptional 67.5% |
| Serbians | 93.9 /100 | #120 | Exceptional 67.4% |
| Slovenes | 93.3 /100 | #121 | Exceptional 67.3% |
| Immigrants | Jordan | 92.8 /100 | #122 | Exceptional 67.3% |
| Immigrants | Northern Africa | 92.7 /100 | #123 | Exceptional 67.2% |
| Arabs | 92.6 /100 | #124 | Exceptional 67.2% |