Immigrants from Belarus vs American College, Under 1 year
COMPARE
Immigrants from Belarus
American
College, Under 1 year
College, Under 1 year Comparison
Immigrants from Belarus
Americans
69.2%
COLLEGE, UNDER 1 YEAR
99.5/ 100
METRIC RATING
62nd/ 347
METRIC RANK
61.0%
COLLEGE, UNDER 1 YEAR
0.2/ 100
METRIC RATING
267th/ 347
METRIC RANK
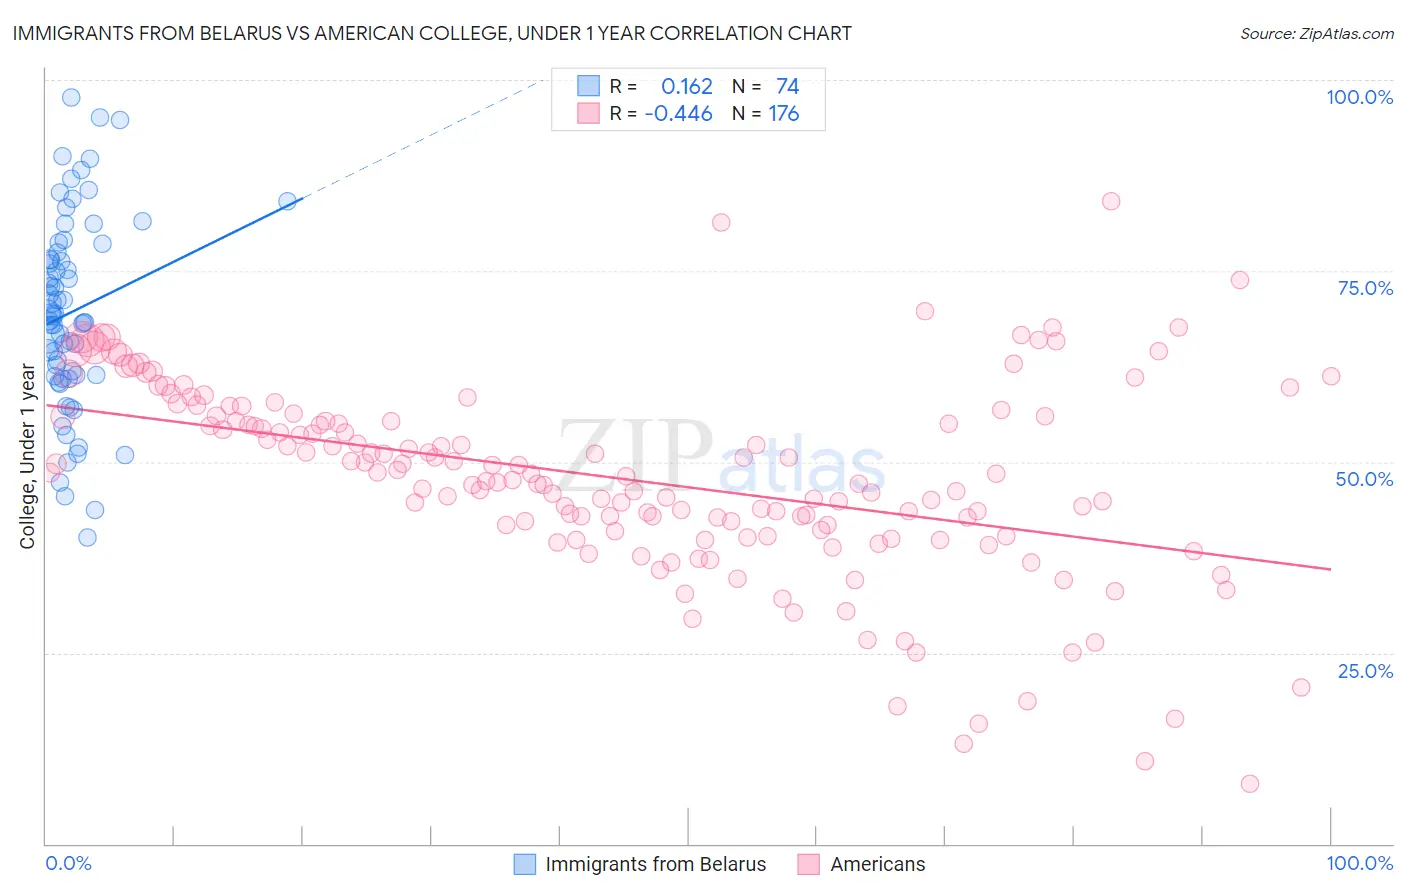
Immigrants from Belarus vs American College, Under 1 year Correlation Chart
The statistical analysis conducted on geographies consisting of 150,205,158 people shows a poor positive correlation between the proportion of Immigrants from Belarus and percentage of population with at least college, under 1 year education in the United States with a correlation coefficient (R) of 0.162 and weighted average of 69.2%. Similarly, the statistical analysis conducted on geographies consisting of 581,978,241 people shows a moderate negative correlation between the proportion of Americans and percentage of population with at least college, under 1 year education in the United States with a correlation coefficient (R) of -0.446 and weighted average of 61.0%, a difference of 13.4%.
College, Under 1 year Correlation Summary
| Measurement | Immigrants from Belarus | American |
| Minimum | 40.0% | 7.8% |
| Maximum | 97.7% | 84.1% |
| Range | 57.6% | 76.3% |
| Mean | 69.6% | 47.8% |
| Median | 69.2% | 48.2% |
| Interquartile 25% (IQ1) | 61.3% | 41.1% |
| Interquartile 75% (IQ3) | 77.5% | 55.9% |
| Interquartile Range (IQR) | 16.2% | 14.9% |
| Standard Deviation (Sample) | 12.6% | 12.8% |
| Standard Deviation (Population) | 12.5% | 12.8% |
Similar Demographics by College, Under 1 year
Demographics Similar to Immigrants from Belarus by College, Under 1 year
In terms of college, under 1 year, the demographic groups most similar to Immigrants from Belarus are Immigrants from Kazakhstan (69.2%, a difference of 0.0%), Immigrants from Asia (69.2%, a difference of 0.040%), Immigrants from Serbia (69.3%, a difference of 0.13%), Immigrants from Canada (69.1%, a difference of 0.13%), and Northern European (69.0%, a difference of 0.17%).
| Demographics | Rating | Rank | College, Under 1 year |
| Maltese | 99.7 /100 | #55 | Exceptional 69.5% |
| Immigrants | Scotland | 99.6 /100 | #56 | Exceptional 69.4% |
| Asians | 99.6 /100 | #57 | Exceptional 69.4% |
| Immigrants | Malaysia | 99.6 /100 | #58 | Exceptional 69.3% |
| Immigrants | Serbia | 99.5 /100 | #59 | Exceptional 69.3% |
| Immigrants | Asia | 99.5 /100 | #60 | Exceptional 69.2% |
| Immigrants | Kazakhstan | 99.5 /100 | #61 | Exceptional 69.2% |
| Immigrants | Belarus | 99.5 /100 | #62 | Exceptional 69.2% |
| Immigrants | Canada | 99.4 /100 | #63 | Exceptional 69.1% |
| Northern Europeans | 99.4 /100 | #64 | Exceptional 69.0% |
| Immigrants | Moldova | 99.3 /100 | #65 | Exceptional 69.0% |
| Immigrants | North America | 99.3 /100 | #66 | Exceptional 69.0% |
| Immigrants | Zimbabwe | 99.2 /100 | #67 | Exceptional 68.9% |
| Immigrants | Indonesia | 99.2 /100 | #68 | Exceptional 68.9% |
| Immigrants | Romania | 99.2 /100 | #69 | Exceptional 68.9% |
Demographics Similar to Americans by College, Under 1 year
In terms of college, under 1 year, the demographic groups most similar to Americans are Alaskan Athabascan (61.0%, a difference of 0.010%), Trinidadian and Tobagonian (61.1%, a difference of 0.13%), Immigrants from Bahamas (61.1%, a difference of 0.13%), Shoshone (61.1%, a difference of 0.19%), and Barbadian (61.1%, a difference of 0.20%).
| Demographics | Rating | Rank | College, Under 1 year |
| Blackfeet | 0.3 /100 | #260 | Tragic 61.1% |
| Africans | 0.3 /100 | #261 | Tragic 61.1% |
| Barbadians | 0.2 /100 | #262 | Tragic 61.1% |
| Shoshone | 0.2 /100 | #263 | Tragic 61.1% |
| Trinidadians and Tobagonians | 0.2 /100 | #264 | Tragic 61.1% |
| Immigrants | Bahamas | 0.2 /100 | #265 | Tragic 61.1% |
| Alaskan Athabascans | 0.2 /100 | #266 | Tragic 61.0% |
| Americans | 0.2 /100 | #267 | Tragic 61.0% |
| Immigrants | Trinidad and Tobago | 0.1 /100 | #268 | Tragic 60.7% |
| Immigrants | West Indies | 0.1 /100 | #269 | Tragic 60.6% |
| Cheyenne | 0.1 /100 | #270 | Tragic 60.6% |
| U.S. Virgin Islanders | 0.1 /100 | #271 | Tragic 60.6% |
| Jamaicans | 0.1 /100 | #272 | Tragic 60.5% |
| Chickasaw | 0.1 /100 | #273 | Tragic 60.4% |
| Alaska Natives | 0.1 /100 | #274 | Tragic 60.4% |