Immigrants from Belarus vs Immigrants from Thailand College, 1 year or more
COMPARE
Immigrants from Belarus
Immigrants from Thailand
College, 1 year or more
College, 1 year or more Comparison
Immigrants from Belarus
Immigrants from Thailand
64.1%
COLLEGE, 1 YEAR OR MORE
99.7/ 100
METRIC RATING
55th/ 347
METRIC RANK
58.6%
COLLEGE, 1 YEAR OR MORE
26.0/ 100
METRIC RATING
197th/ 347
METRIC RANK
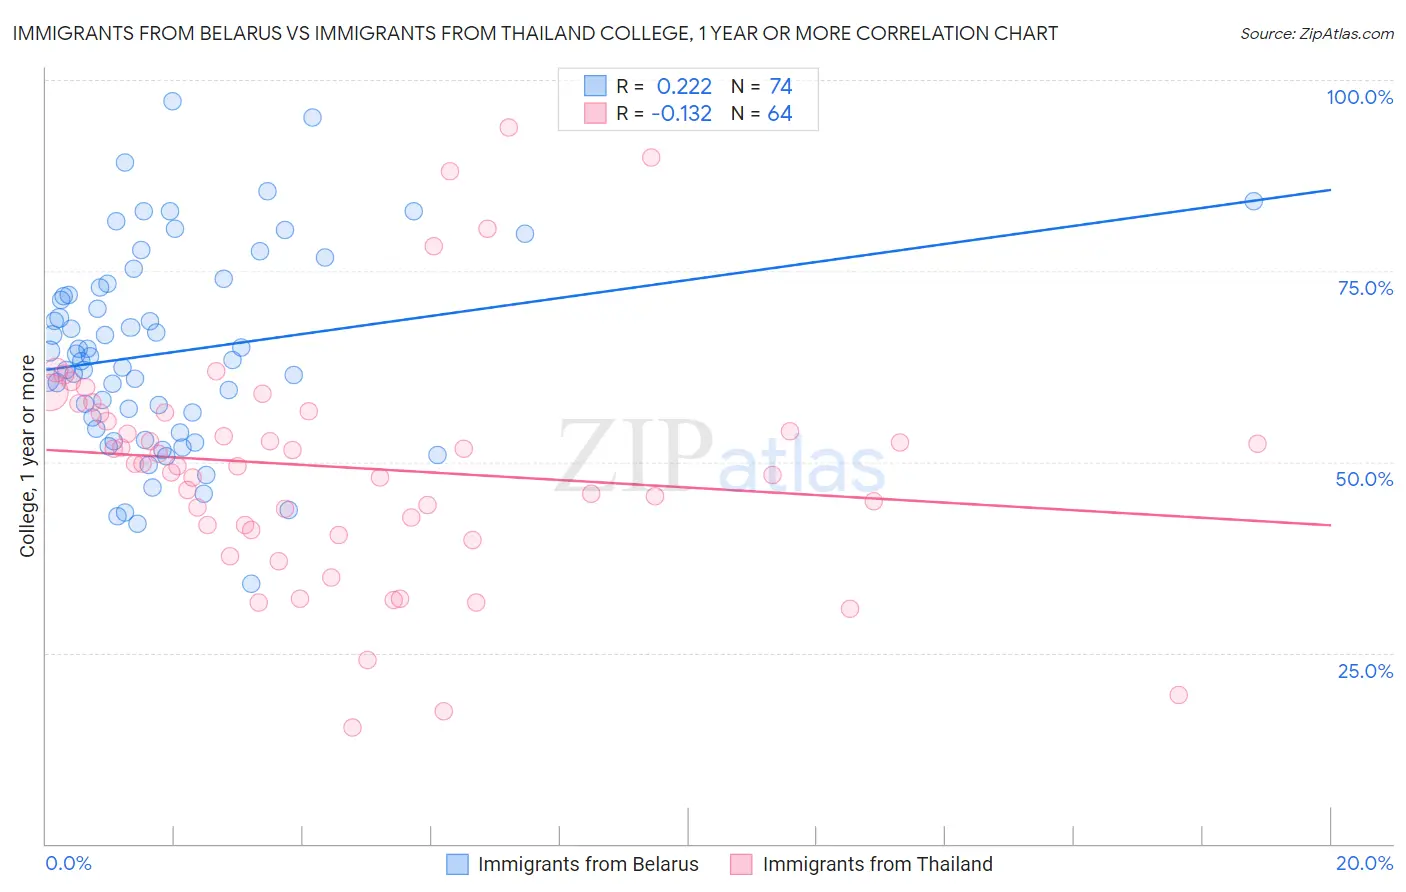
Immigrants from Belarus vs Immigrants from Thailand College, 1 year or more Correlation Chart
The statistical analysis conducted on geographies consisting of 150,205,158 people shows a weak positive correlation between the proportion of Immigrants from Belarus and percentage of population with at least college, 1 year or more education in the United States with a correlation coefficient (R) of 0.222 and weighted average of 64.1%. Similarly, the statistical analysis conducted on geographies consisting of 317,023,435 people shows a poor negative correlation between the proportion of Immigrants from Thailand and percentage of population with at least college, 1 year or more education in the United States with a correlation coefficient (R) of -0.132 and weighted average of 58.6%, a difference of 9.4%.
College, 1 year or more Correlation Summary
| Measurement | Immigrants from Belarus | Immigrants from Thailand |
| Minimum | 34.0% | 15.2% |
| Maximum | 97.2% | 93.8% |
| Range | 63.1% | 78.6% |
| Mean | 64.3% | 49.3% |
| Median | 63.6% | 49.6% |
| Interquartile 25% (IQ1) | 54.4% | 41.4% |
| Interquartile 75% (IQ3) | 72.8% | 56.5% |
| Interquartile Range (IQR) | 18.4% | 15.1% |
| Standard Deviation (Sample) | 13.1% | 15.4% |
| Standard Deviation (Population) | 13.0% | 15.3% |
Similar Demographics by College, 1 year or more
Demographics Similar to Immigrants from Belarus by College, 1 year or more
In terms of college, 1 year or more, the demographic groups most similar to Immigrants from Belarus are Immigrants from Czechoslovakia (64.1%, a difference of 0.030%), South African (64.1%, a difference of 0.040%), Zimbabwean (64.2%, a difference of 0.12%), Asian (64.2%, a difference of 0.15%), and Immigrants from Netherlands (64.2%, a difference of 0.17%).
| Demographics | Rating | Rank | College, 1 year or more |
| Immigrants | Bulgaria | 99.9 /100 | #48 | Exceptional 64.6% |
| New Zealanders | 99.9 /100 | #49 | Exceptional 64.6% |
| Immigrants | Austria | 99.8 /100 | #50 | Exceptional 64.4% |
| Immigrants | Malaysia | 99.8 /100 | #51 | Exceptional 64.3% |
| Immigrants | Netherlands | 99.8 /100 | #52 | Exceptional 64.2% |
| Asians | 99.8 /100 | #53 | Exceptional 64.2% |
| Zimbabweans | 99.8 /100 | #54 | Exceptional 64.2% |
| Immigrants | Belarus | 99.7 /100 | #55 | Exceptional 64.1% |
| Immigrants | Czechoslovakia | 99.7 /100 | #56 | Exceptional 64.1% |
| South Africans | 99.7 /100 | #57 | Exceptional 64.1% |
| Immigrants | Asia | 99.7 /100 | #58 | Exceptional 64.0% |
| Immigrants | Serbia | 99.6 /100 | #59 | Exceptional 63.8% |
| Immigrants | Kazakhstan | 99.5 /100 | #60 | Exceptional 63.6% |
| Bolivians | 99.5 /100 | #61 | Exceptional 63.5% |
| Immigrants | Indonesia | 99.5 /100 | #62 | Exceptional 63.5% |
Demographics Similar to Immigrants from Thailand by College, 1 year or more
In terms of college, 1 year or more, the demographic groups most similar to Immigrants from Thailand are Dutch (58.6%, a difference of 0.010%), Guamanian/Chamorro (58.6%, a difference of 0.010%), Costa Rican (58.6%, a difference of 0.030%), Immigrants from South Eastern Asia (58.5%, a difference of 0.070%), and Peruvian (58.6%, a difference of 0.10%).
| Demographics | Rating | Rank | College, 1 year or more |
| Immigrants | Cameroon | 31.2 /100 | #190 | Fair 58.8% |
| Immigrants | Philippines | 29.2 /100 | #191 | Fair 58.7% |
| Colombians | 27.6 /100 | #192 | Fair 58.7% |
| Peruvians | 27.5 /100 | #193 | Fair 58.6% |
| Costa Ricans | 26.4 /100 | #194 | Fair 58.6% |
| Dutch | 26.2 /100 | #195 | Fair 58.6% |
| Guamanians/Chamorros | 26.2 /100 | #196 | Fair 58.6% |
| Immigrants | Thailand | 26.0 /100 | #197 | Fair 58.6% |
| Immigrants | South Eastern Asia | 25.1 /100 | #198 | Fair 58.5% |
| Slovaks | 24.6 /100 | #199 | Fair 58.5% |
| Spanish | 24.2 /100 | #200 | Fair 58.5% |
| Nigerians | 23.0 /100 | #201 | Fair 58.5% |
| Immigrants | South America | 21.9 /100 | #202 | Fair 58.4% |
| Ghanaians | 20.9 /100 | #203 | Fair 58.4% |
| Panamanians | 19.2 /100 | #204 | Poor 58.3% |