Immigrants from Hungary vs Immigrants from Thailand College, 1 year or more
COMPARE
Immigrants from Hungary
Immigrants from Thailand
College, 1 year or more
College, 1 year or more Comparison
Immigrants from Hungary
Immigrants from Thailand
62.7%
COLLEGE, 1 YEAR OR MORE
98.6/ 100
METRIC RATING
87th/ 347
METRIC RANK
58.6%
COLLEGE, 1 YEAR OR MORE
26.0/ 100
METRIC RATING
197th/ 347
METRIC RANK
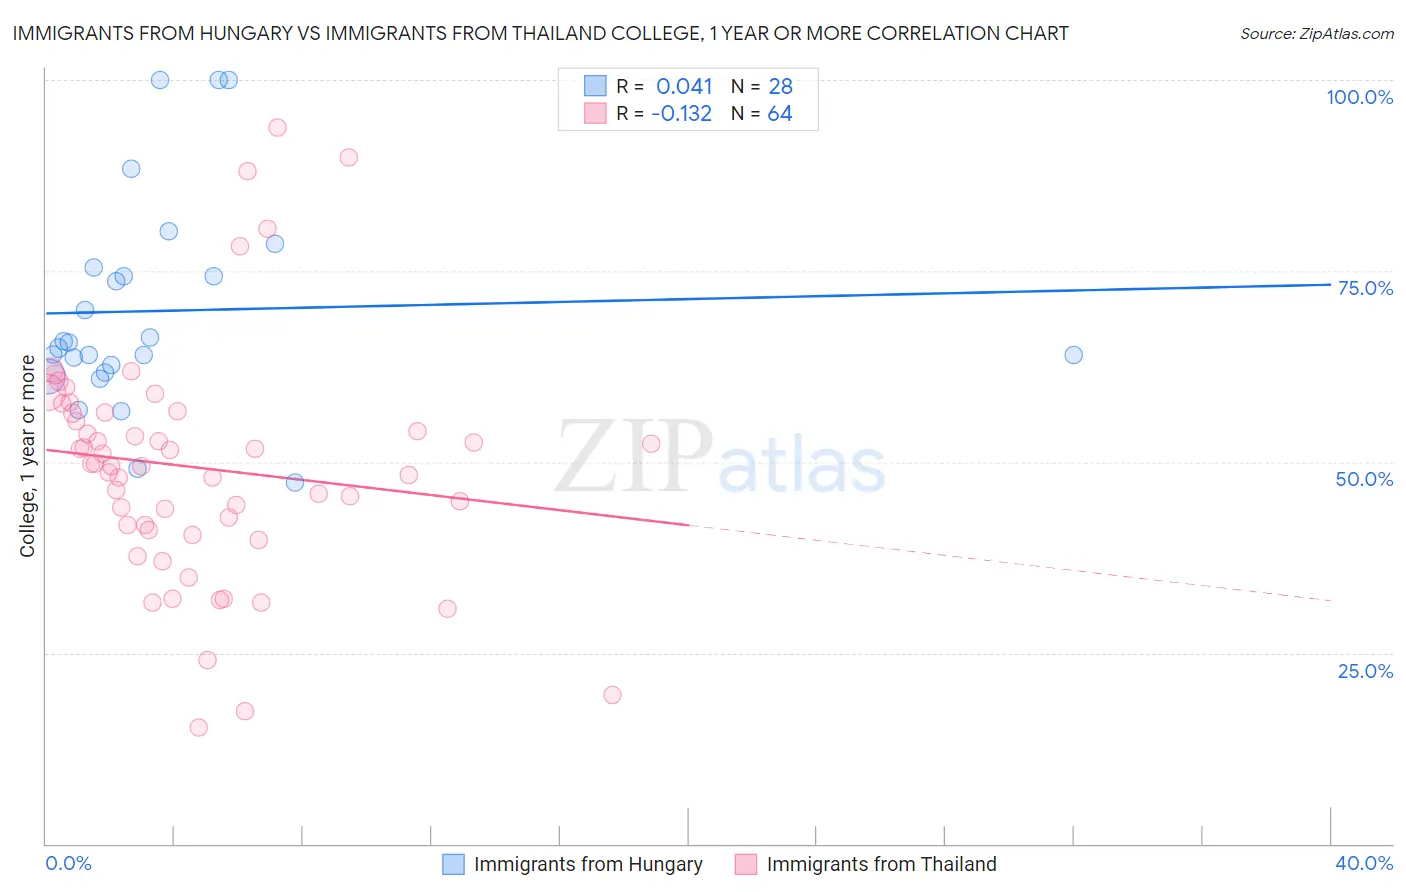
Immigrants from Hungary vs Immigrants from Thailand College, 1 year or more Correlation Chart
The statistical analysis conducted on geographies consisting of 195,707,305 people shows no correlation between the proportion of Immigrants from Hungary and percentage of population with at least college, 1 year or more education in the United States with a correlation coefficient (R) of 0.041 and weighted average of 62.7%. Similarly, the statistical analysis conducted on geographies consisting of 317,023,435 people shows a poor negative correlation between the proportion of Immigrants from Thailand and percentage of population with at least college, 1 year or more education in the United States with a correlation coefficient (R) of -0.132 and weighted average of 58.6%, a difference of 7.1%.
College, 1 year or more Correlation Summary
| Measurement | Immigrants from Hungary | Immigrants from Thailand |
| Minimum | 47.4% | 15.2% |
| Maximum | 100.0% | 93.8% |
| Range | 52.6% | 78.6% |
| Mean | 69.8% | 49.3% |
| Median | 65.3% | 49.6% |
| Interquartile 25% (IQ1) | 62.2% | 41.4% |
| Interquartile 75% (IQ3) | 74.9% | 56.5% |
| Interquartile Range (IQR) | 12.7% | 15.1% |
| Standard Deviation (Sample) | 13.8% | 15.4% |
| Standard Deviation (Population) | 13.5% | 15.3% |
Similar Demographics by College, 1 year or more
Demographics Similar to Immigrants from Hungary by College, 1 year or more
In terms of college, 1 year or more, the demographic groups most similar to Immigrants from Hungary are Immigrants from Western Europe (62.7%, a difference of 0.020%), Immigrants from England (62.8%, a difference of 0.040%), Immigrants from Pakistan (62.8%, a difference of 0.040%), Immigrants from Argentina (62.8%, a difference of 0.080%), and Immigrants from Bolivia (62.8%, a difference of 0.11%).
| Demographics | Rating | Rank | College, 1 year or more |
| Lithuanians | 98.8 /100 | #80 | Exceptional 62.9% |
| Laotians | 98.7 /100 | #81 | Exceptional 62.8% |
| Immigrants | Bolivia | 98.7 /100 | #82 | Exceptional 62.8% |
| Immigrants | Argentina | 98.6 /100 | #83 | Exceptional 62.8% |
| Immigrants | England | 98.6 /100 | #84 | Exceptional 62.8% |
| Immigrants | Pakistan | 98.6 /100 | #85 | Exceptional 62.8% |
| Immigrants | Western Europe | 98.6 /100 | #86 | Exceptional 62.7% |
| Immigrants | Hungary | 98.6 /100 | #87 | Exceptional 62.7% |
| Greeks | 98.3 /100 | #88 | Exceptional 62.6% |
| Immigrants | Ethiopia | 98.2 /100 | #89 | Exceptional 62.6% |
| Immigrants | Western Asia | 97.9 /100 | #90 | Exceptional 62.5% |
| Immigrants | Eastern Europe | 97.8 /100 | #91 | Exceptional 62.4% |
| Immigrants | Egypt | 97.8 /100 | #92 | Exceptional 62.4% |
| Romanians | 97.7 /100 | #93 | Exceptional 62.4% |
| Immigrants | Croatia | 97.6 /100 | #94 | Exceptional 62.3% |
Demographics Similar to Immigrants from Thailand by College, 1 year or more
In terms of college, 1 year or more, the demographic groups most similar to Immigrants from Thailand are Dutch (58.6%, a difference of 0.010%), Guamanian/Chamorro (58.6%, a difference of 0.010%), Costa Rican (58.6%, a difference of 0.030%), Immigrants from South Eastern Asia (58.5%, a difference of 0.070%), and Peruvian (58.6%, a difference of 0.10%).
| Demographics | Rating | Rank | College, 1 year or more |
| Immigrants | Cameroon | 31.2 /100 | #190 | Fair 58.8% |
| Immigrants | Philippines | 29.2 /100 | #191 | Fair 58.7% |
| Colombians | 27.6 /100 | #192 | Fair 58.7% |
| Peruvians | 27.5 /100 | #193 | Fair 58.6% |
| Costa Ricans | 26.4 /100 | #194 | Fair 58.6% |
| Dutch | 26.2 /100 | #195 | Fair 58.6% |
| Guamanians/Chamorros | 26.2 /100 | #196 | Fair 58.6% |
| Immigrants | Thailand | 26.0 /100 | #197 | Fair 58.6% |
| Immigrants | South Eastern Asia | 25.1 /100 | #198 | Fair 58.5% |
| Slovaks | 24.6 /100 | #199 | Fair 58.5% |
| Spanish | 24.2 /100 | #200 | Fair 58.5% |
| Nigerians | 23.0 /100 | #201 | Fair 58.5% |
| Immigrants | South America | 21.9 /100 | #202 | Fair 58.4% |
| Ghanaians | 20.9 /100 | #203 | Fair 58.4% |
| Panamanians | 19.2 /100 | #204 | Poor 58.3% |