Immigrants from Belarus vs Bulgarian College, 1 year or more
COMPARE
Immigrants from Belarus
Bulgarian
College, 1 year or more
College, 1 year or more Comparison
Immigrants from Belarus
Bulgarians
64.1%
COLLEGE, 1 YEAR OR MORE
99.7/ 100
METRIC RATING
55th/ 347
METRIC RANK
65.5%
COLLEGE, 1 YEAR OR MORE
100.0/ 100
METRIC RATING
32nd/ 347
METRIC RANK
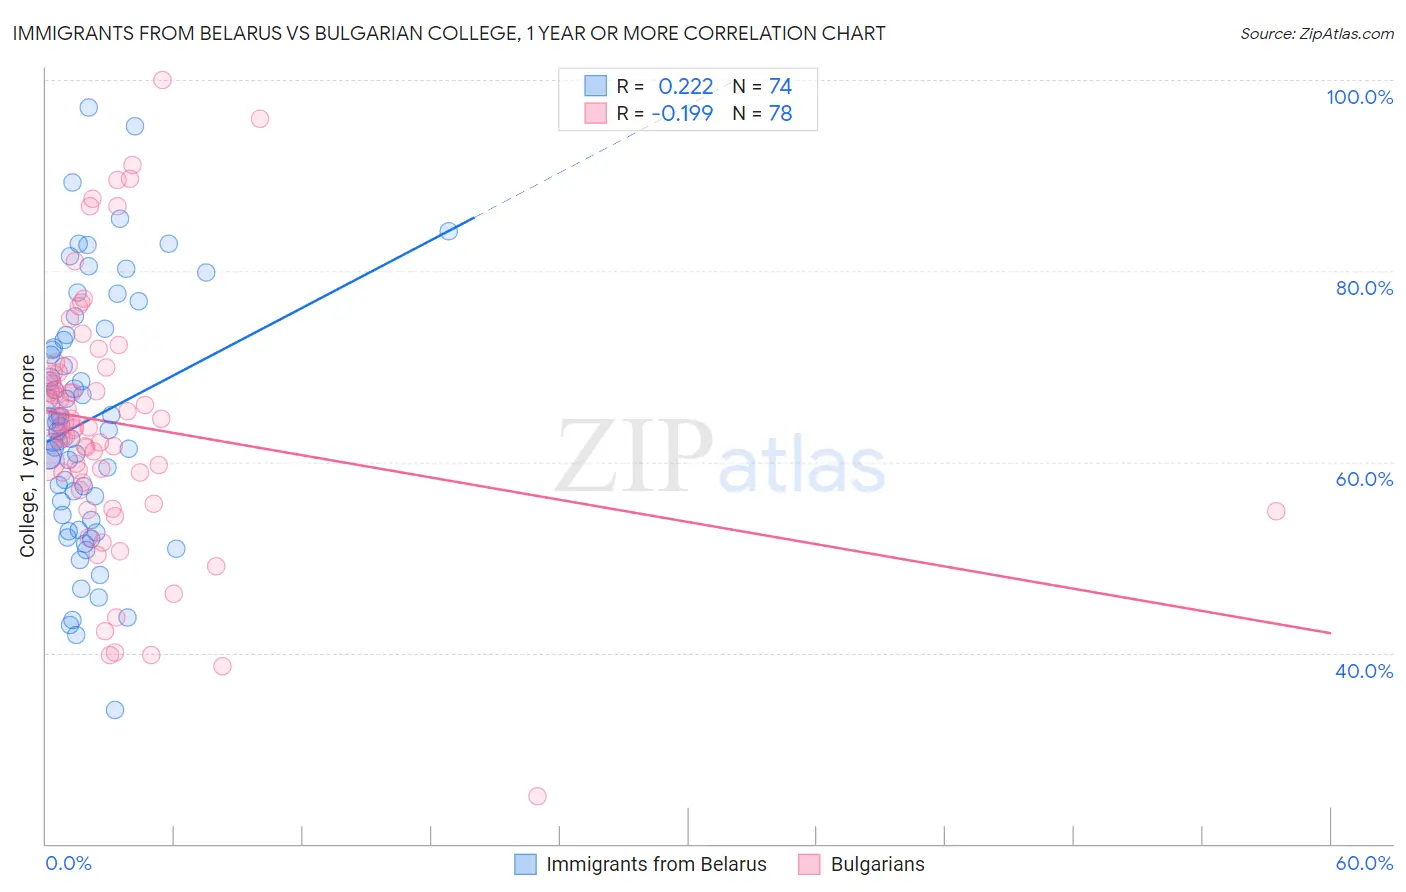
Immigrants from Belarus vs Bulgarian College, 1 year or more Correlation Chart
The statistical analysis conducted on geographies consisting of 150,205,158 people shows a weak positive correlation between the proportion of Immigrants from Belarus and percentage of population with at least college, 1 year or more education in the United States with a correlation coefficient (R) of 0.222 and weighted average of 64.1%. Similarly, the statistical analysis conducted on geographies consisting of 205,631,725 people shows a poor negative correlation between the proportion of Bulgarians and percentage of population with at least college, 1 year or more education in the United States with a correlation coefficient (R) of -0.199 and weighted average of 65.5%, a difference of 2.2%.
College, 1 year or more Correlation Summary
| Measurement | Immigrants from Belarus | Bulgarian |
| Minimum | 34.0% | 25.0% |
| Maximum | 97.2% | 100.0% |
| Range | 63.1% | 75.0% |
| Mean | 64.3% | 64.0% |
| Median | 63.6% | 63.9% |
| Interquartile 25% (IQ1) | 54.4% | 57.8% |
| Interquartile 75% (IQ3) | 72.8% | 69.4% |
| Interquartile Range (IQR) | 18.4% | 11.5% |
| Standard Deviation (Sample) | 13.1% | 13.5% |
| Standard Deviation (Population) | 13.0% | 13.4% |
Similar Demographics by College, 1 year or more
Demographics Similar to Immigrants from Belarus by College, 1 year or more
In terms of college, 1 year or more, the demographic groups most similar to Immigrants from Belarus are Immigrants from Czechoslovakia (64.1%, a difference of 0.030%), South African (64.1%, a difference of 0.040%), Zimbabwean (64.2%, a difference of 0.12%), Asian (64.2%, a difference of 0.15%), and Immigrants from Netherlands (64.2%, a difference of 0.17%).
| Demographics | Rating | Rank | College, 1 year or more |
| Immigrants | Bulgaria | 99.9 /100 | #48 | Exceptional 64.6% |
| New Zealanders | 99.9 /100 | #49 | Exceptional 64.6% |
| Immigrants | Austria | 99.8 /100 | #50 | Exceptional 64.4% |
| Immigrants | Malaysia | 99.8 /100 | #51 | Exceptional 64.3% |
| Immigrants | Netherlands | 99.8 /100 | #52 | Exceptional 64.2% |
| Asians | 99.8 /100 | #53 | Exceptional 64.2% |
| Zimbabweans | 99.8 /100 | #54 | Exceptional 64.2% |
| Immigrants | Belarus | 99.7 /100 | #55 | Exceptional 64.1% |
| Immigrants | Czechoslovakia | 99.7 /100 | #56 | Exceptional 64.1% |
| South Africans | 99.7 /100 | #57 | Exceptional 64.1% |
| Immigrants | Asia | 99.7 /100 | #58 | Exceptional 64.0% |
| Immigrants | Serbia | 99.6 /100 | #59 | Exceptional 63.8% |
| Immigrants | Kazakhstan | 99.5 /100 | #60 | Exceptional 63.6% |
| Bolivians | 99.5 /100 | #61 | Exceptional 63.5% |
| Immigrants | Indonesia | 99.5 /100 | #62 | Exceptional 63.5% |
Demographics Similar to Bulgarians by College, 1 year or more
In terms of college, 1 year or more, the demographic groups most similar to Bulgarians are Turkish (65.5%, a difference of 0.050%), Immigrants from Denmark (65.6%, a difference of 0.13%), Immigrants from Sri Lanka (65.4%, a difference of 0.15%), Immigrants from Northern Europe (65.6%, a difference of 0.24%), and Israeli (65.3%, a difference of 0.27%).
| Demographics | Rating | Rank | College, 1 year or more |
| Indians (Asian) | 100.0 /100 | #25 | Exceptional 66.1% |
| Latvians | 100.0 /100 | #26 | Exceptional 66.1% |
| Immigrants | Ireland | 100.0 /100 | #27 | Exceptional 65.9% |
| Immigrants | France | 100.0 /100 | #28 | Exceptional 65.8% |
| Immigrants | Northern Europe | 100.0 /100 | #29 | Exceptional 65.6% |
| Immigrants | Denmark | 100.0 /100 | #30 | Exceptional 65.6% |
| Turks | 100.0 /100 | #31 | Exceptional 65.5% |
| Bulgarians | 100.0 /100 | #32 | Exceptional 65.5% |
| Immigrants | Sri Lanka | 99.9 /100 | #33 | Exceptional 65.4% |
| Israelis | 99.9 /100 | #34 | Exceptional 65.3% |
| Immigrants | Turkey | 99.9 /100 | #35 | Exceptional 65.2% |
| Immigrants | South Africa | 99.9 /100 | #36 | Exceptional 65.1% |
| Russians | 99.9 /100 | #37 | Exceptional 65.1% |
| Immigrants | Saudi Arabia | 99.9 /100 | #38 | Exceptional 65.0% |
| Estonians | 99.9 /100 | #39 | Exceptional 65.0% |