Immigrants from Barbados vs Ecuadorian 5th Grade
COMPARE
Immigrants from Barbados
Ecuadorian
5th Grade
5th Grade Comparison
Immigrants from Barbados
Ecuadorians
96.6%
5TH GRADE
0.0/ 100
METRIC RATING
288th/ 347
METRIC RANK
96.0%
5TH GRADE
0.0/ 100
METRIC RATING
308th/ 347
METRIC RANK
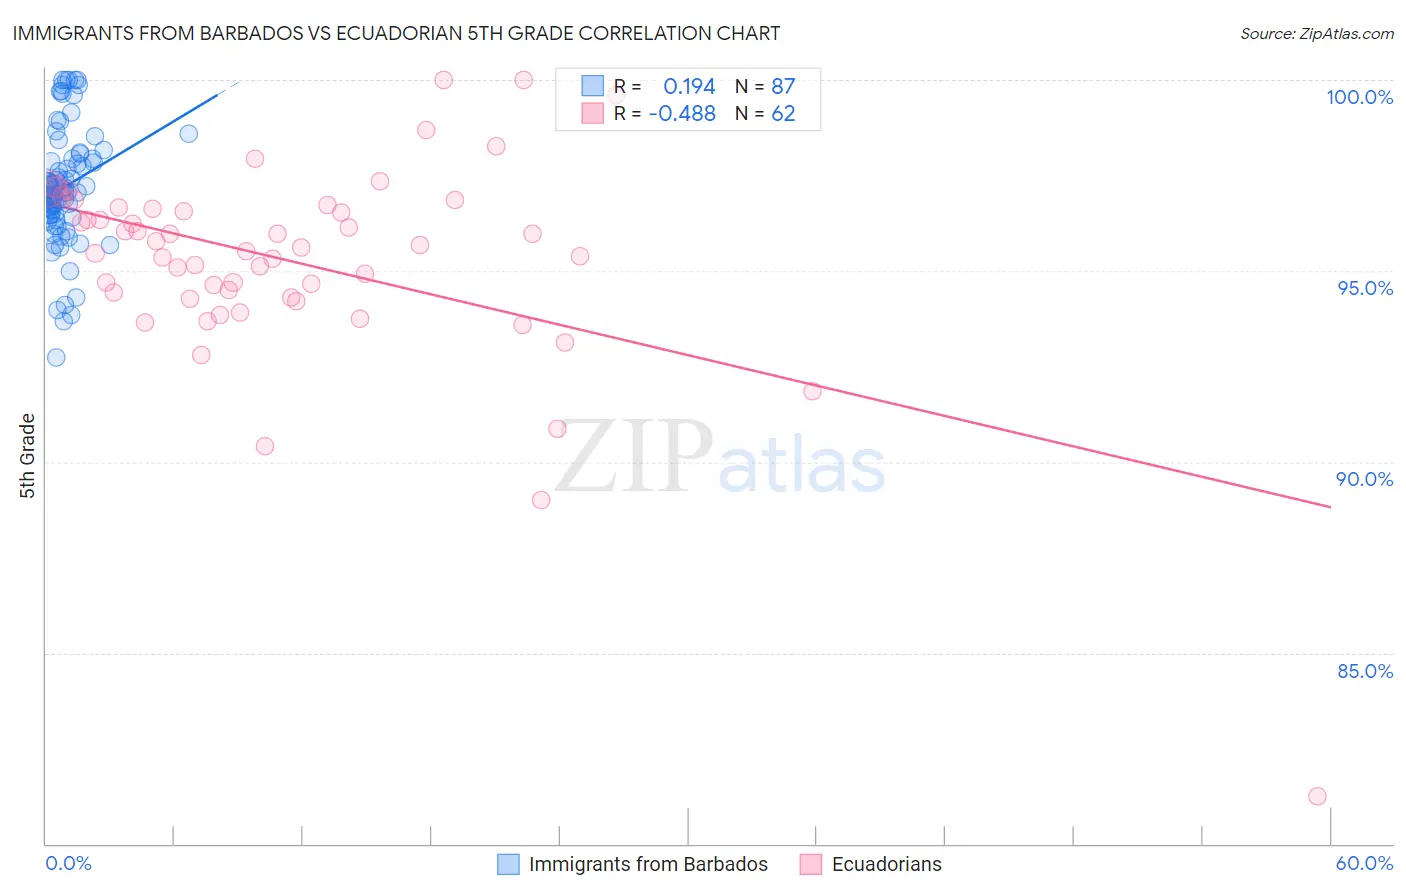
Immigrants from Barbados vs Ecuadorian 5th Grade Correlation Chart
The statistical analysis conducted on geographies consisting of 112,788,359 people shows a poor positive correlation between the proportion of Immigrants from Barbados and percentage of population with at least 5th grade education in the United States with a correlation coefficient (R) of 0.194 and weighted average of 96.6%. Similarly, the statistical analysis conducted on geographies consisting of 317,865,755 people shows a moderate negative correlation between the proportion of Ecuadorians and percentage of population with at least 5th grade education in the United States with a correlation coefficient (R) of -0.488 and weighted average of 96.0%, a difference of 0.56%.
5th Grade Correlation Summary
| Measurement | Immigrants from Barbados | Ecuadorian |
| Minimum | 92.7% | 81.2% |
| Maximum | 100.0% | 100.0% |
| Range | 7.3% | 18.7% |
| Mean | 97.2% | 95.2% |
| Median | 97.1% | 95.6% |
| Interquartile 25% (IQ1) | 96.5% | 94.3% |
| Interquartile 75% (IQ3) | 97.9% | 96.6% |
| Interquartile Range (IQR) | 1.5% | 2.3% |
| Standard Deviation (Sample) | 1.5% | 2.7% |
| Standard Deviation (Population) | 1.5% | 2.7% |
Demographics Similar to Immigrants from Barbados and Ecuadorians by 5th Grade
In terms of 5th grade, the demographic groups most similar to Immigrants from Barbados are Immigrants from West Indies (96.5%, a difference of 0.070%), British West Indian (96.5%, a difference of 0.090%), Malaysian (96.5%, a difference of 0.090%), Somali (96.5%, a difference of 0.090%), and Immigrants from Grenada (96.5%, a difference of 0.10%). Similarly, the demographic groups most similar to Ecuadorians are Immigrants from Haiti (96.0%, a difference of 0.010%), Immigrants from Caribbean (96.0%, a difference of 0.010%), Immigrants from Laos (96.0%, a difference of 0.030%), Immigrants from Burma/Myanmar (96.1%, a difference of 0.040%), and Puerto Rican (96.1%, a difference of 0.070%).
| Demographics | Rating | Rank | 5th Grade |
| Immigrants | Barbados | 0.0 /100 | #288 | Tragic 96.6% |
| Immigrants | West Indies | 0.0 /100 | #289 | Tragic 96.5% |
| British West Indians | 0.0 /100 | #290 | Tragic 96.5% |
| Malaysians | 0.0 /100 | #291 | Tragic 96.5% |
| Somalis | 0.0 /100 | #292 | Tragic 96.5% |
| Immigrants | Grenada | 0.0 /100 | #293 | Tragic 96.5% |
| Immigrants | Eritrea | 0.0 /100 | #294 | Tragic 96.4% |
| Immigrants | Somalia | 0.0 /100 | #295 | Tragic 96.4% |
| Immigrants | South Eastern Asia | 0.0 /100 | #296 | Tragic 96.3% |
| Haitians | 0.0 /100 | #297 | Tragic 96.3% |
| Immigrants | Dominica | 0.0 /100 | #298 | Tragic 96.2% |
| Immigrants | Immigrants | 0.0 /100 | #299 | Tragic 96.2% |
| Sri Lankans | 0.0 /100 | #300 | Tragic 96.1% |
| Immigrants | Cuba | 0.0 /100 | #301 | Tragic 96.1% |
| Guyanese | 0.0 /100 | #302 | Tragic 96.1% |
| Puerto Ricans | 0.0 /100 | #303 | Tragic 96.1% |
| Immigrants | Burma/Myanmar | 0.0 /100 | #304 | Tragic 96.1% |
| Immigrants | Laos | 0.0 /100 | #305 | Tragic 96.0% |
| Immigrants | Haiti | 0.0 /100 | #306 | Tragic 96.0% |
| Immigrants | Caribbean | 0.0 /100 | #307 | Tragic 96.0% |
| Ecuadorians | 0.0 /100 | #308 | Tragic 96.0% |