Immigrants from Barbados vs Mexican 5th Grade
COMPARE
Immigrants from Barbados
Mexican
5th Grade
5th Grade Comparison
Immigrants from Barbados
Mexicans
96.6%
5TH GRADE
0.0/ 100
METRIC RATING
288th/ 347
METRIC RANK
95.2%
5TH GRADE
0.0/ 100
METRIC RATING
335th/ 347
METRIC RANK
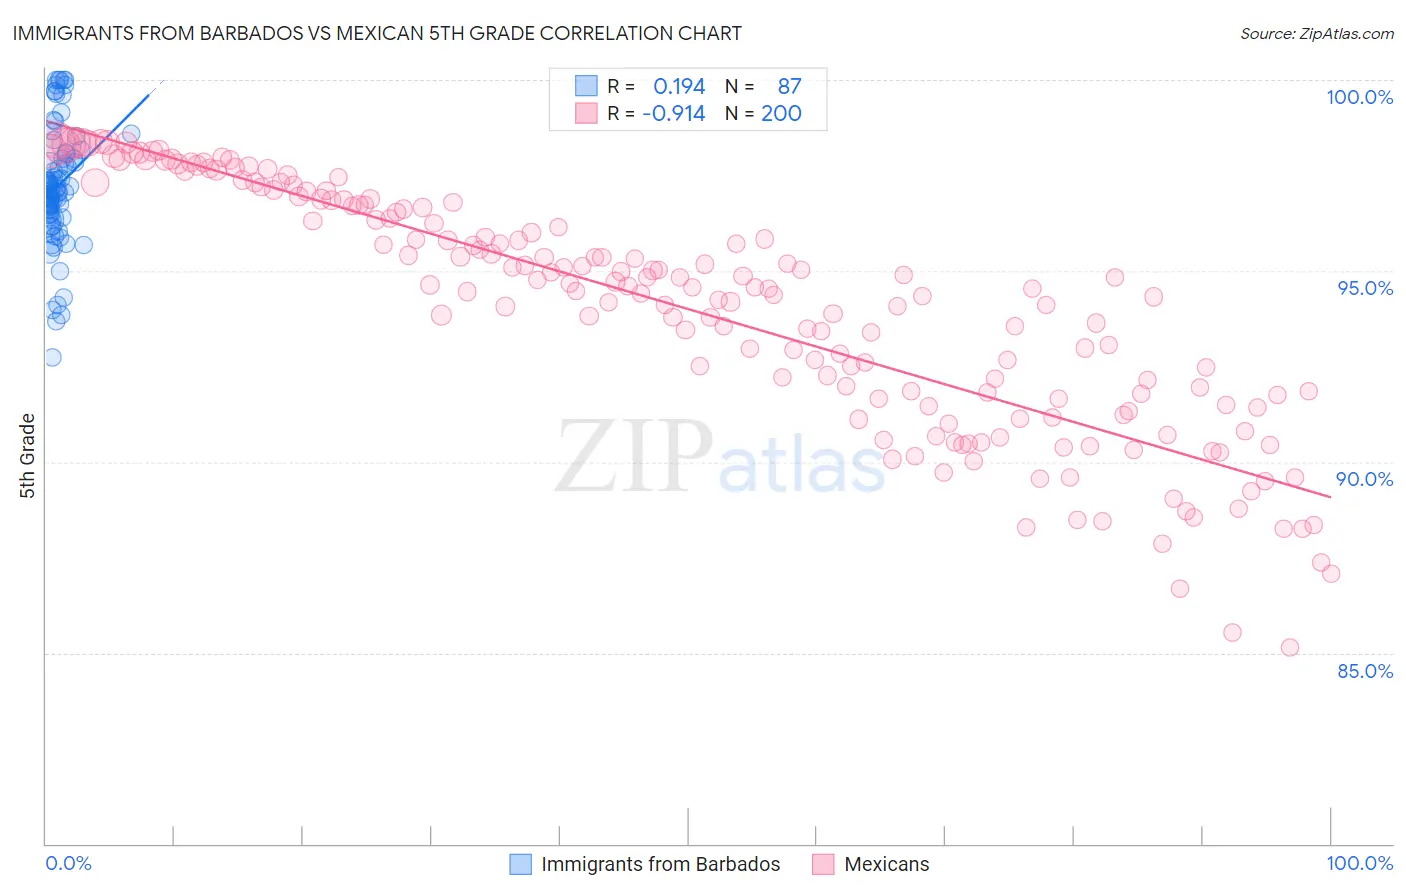
Immigrants from Barbados vs Mexican 5th Grade Correlation Chart
The statistical analysis conducted on geographies consisting of 112,788,359 people shows a poor positive correlation between the proportion of Immigrants from Barbados and percentage of population with at least 5th grade education in the United States with a correlation coefficient (R) of 0.194 and weighted average of 96.6%. Similarly, the statistical analysis conducted on geographies consisting of 565,340,290 people shows a near-perfect negative correlation between the proportion of Mexicans and percentage of population with at least 5th grade education in the United States with a correlation coefficient (R) of -0.914 and weighted average of 95.2%, a difference of 1.4%.
5th Grade Correlation Summary
| Measurement | Immigrants from Barbados | Mexican |
| Minimum | 92.7% | 85.1% |
| Maximum | 100.0% | 98.4% |
| Range | 7.3% | 13.3% |
| Mean | 97.2% | 94.0% |
| Median | 97.1% | 94.6% |
| Interquartile 25% (IQ1) | 96.5% | 91.7% |
| Interquartile 75% (IQ3) | 97.9% | 96.7% |
| Interquartile Range (IQR) | 1.5% | 5.1% |
| Standard Deviation (Sample) | 1.5% | 3.1% |
| Standard Deviation (Population) | 1.5% | 3.1% |
Similar Demographics by 5th Grade
Demographics Similar to Immigrants from Barbados by 5th Grade
In terms of 5th grade, the demographic groups most similar to Immigrants from Barbados are Immigrants from Afghanistan (96.6%, a difference of 0.010%), Immigrants from Thailand (96.6%, a difference of 0.030%), Immigrants from St. Vincent and the Grenadines (96.6%, a difference of 0.040%), Immigrants from Trinidad and Tobago (96.6%, a difference of 0.050%), and Houma (96.6%, a difference of 0.060%).
| Demographics | Rating | Rank | 5th Grade |
| Houma | 0.1 /100 | #281 | Tragic 96.6% |
| Barbadians | 0.1 /100 | #282 | Tragic 96.6% |
| Fijians | 0.1 /100 | #283 | Tragic 96.6% |
| Immigrants | Trinidad and Tobago | 0.1 /100 | #284 | Tragic 96.6% |
| Immigrants | St. Vincent and the Grenadines | 0.1 /100 | #285 | Tragic 96.6% |
| Immigrants | Thailand | 0.1 /100 | #286 | Tragic 96.6% |
| Immigrants | Afghanistan | 0.1 /100 | #287 | Tragic 96.6% |
| Immigrants | Barbados | 0.0 /100 | #288 | Tragic 96.6% |
| Immigrants | West Indies | 0.0 /100 | #289 | Tragic 96.5% |
| British West Indians | 0.0 /100 | #290 | Tragic 96.5% |
| Malaysians | 0.0 /100 | #291 | Tragic 96.5% |
| Somalis | 0.0 /100 | #292 | Tragic 96.5% |
| Immigrants | Grenada | 0.0 /100 | #293 | Tragic 96.5% |
| Immigrants | Eritrea | 0.0 /100 | #294 | Tragic 96.4% |
| Immigrants | Somalia | 0.0 /100 | #295 | Tragic 96.4% |
Demographics Similar to Mexicans by 5th Grade
In terms of 5th grade, the demographic groups most similar to Mexicans are Nepalese (95.2%, a difference of 0.030%), Immigrants from Latin America (95.3%, a difference of 0.050%), Immigrants from Dominican Republic (95.3%, a difference of 0.060%), Immigrants from the Azores (95.1%, a difference of 0.10%), and Immigrants from Honduras (95.4%, a difference of 0.16%).
| Demographics | Rating | Rank | 5th Grade |
| Cape Verdeans | 0.0 /100 | #328 | Tragic 95.5% |
| Mexican American Indians | 0.0 /100 | #329 | Tragic 95.5% |
| Immigrants | Armenia | 0.0 /100 | #330 | Tragic 95.4% |
| Immigrants | Honduras | 0.0 /100 | #331 | Tragic 95.4% |
| Immigrants | Dominican Republic | 0.0 /100 | #332 | Tragic 95.3% |
| Immigrants | Latin America | 0.0 /100 | #333 | Tragic 95.3% |
| Nepalese | 0.0 /100 | #334 | Tragic 95.2% |
| Mexicans | 0.0 /100 | #335 | Tragic 95.2% |
| Immigrants | Azores | 0.0 /100 | #336 | Tragic 95.1% |
| Central Americans | 0.0 /100 | #337 | Tragic 95.1% |
| Immigrants | Cabo Verde | 0.0 /100 | #338 | Tragic 94.9% |
| Immigrants | Yemen | 0.0 /100 | #339 | Tragic 94.9% |
| Guatemalans | 0.0 /100 | #340 | Tragic 94.8% |
| Yakama | 0.0 /100 | #341 | Tragic 94.8% |
| Immigrants | Central America | 0.0 /100 | #342 | Tragic 94.7% |