Immigrants from Barbados vs Immigrants from Scotland Average Family Size
COMPARE
Immigrants from Barbados
Immigrants from Scotland
Average Family Size
Average Family Size Comparison
Immigrants from Barbados
Immigrants from Scotland
3.32
AVERAGE FAMILY SIZE
99.8/ 100
METRIC RATING
75th/ 347
METRIC RANK
3.12
AVERAGE FAMILY SIZE
0.1/ 100
METRIC RATING
315th/ 347
METRIC RANK
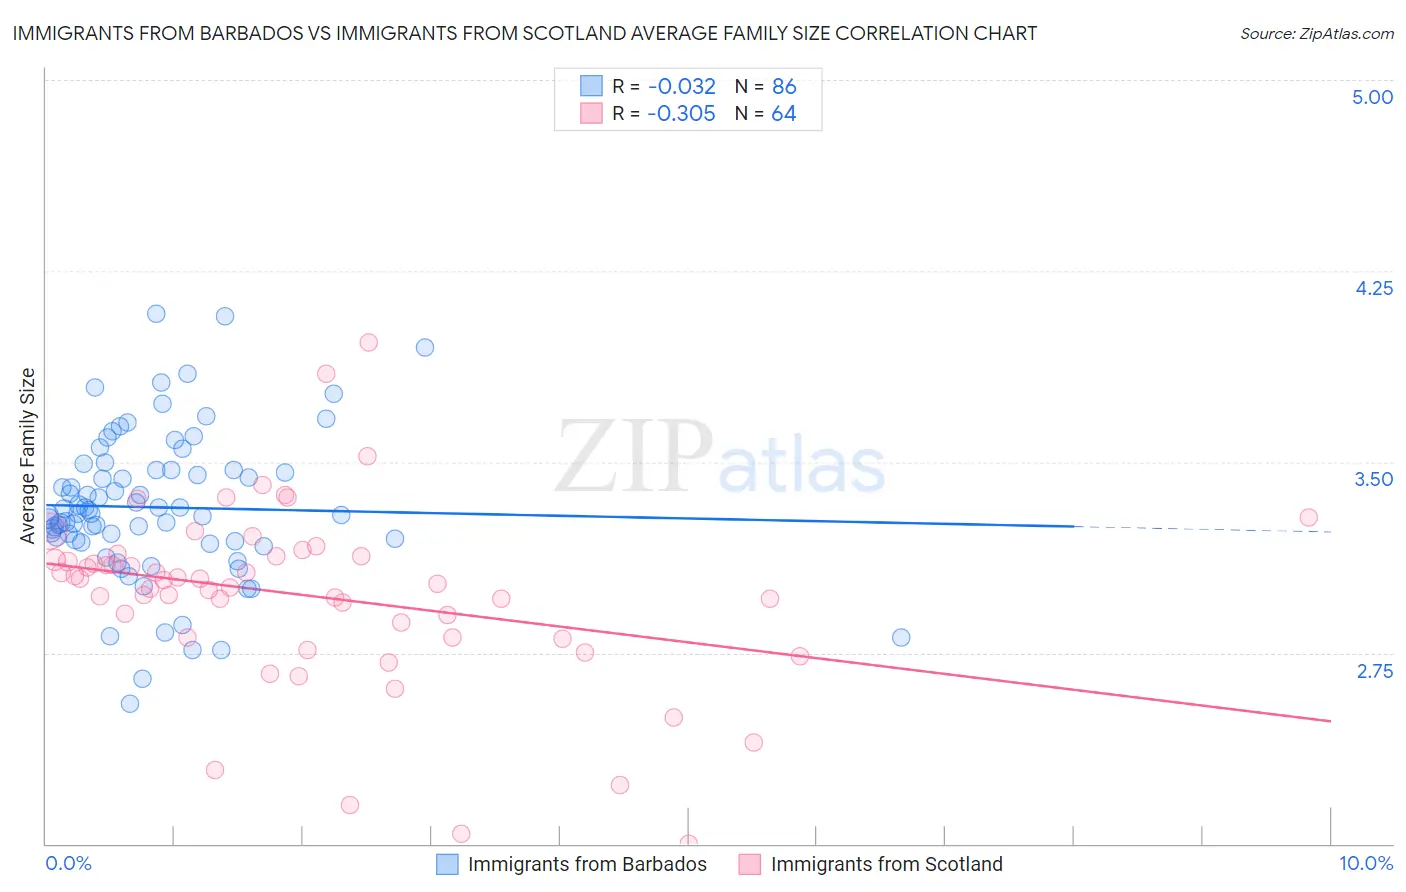
Immigrants from Barbados vs Immigrants from Scotland Average Family Size Correlation Chart
The statistical analysis conducted on geographies consisting of 112,771,790 people shows no correlation between the proportion of Immigrants from Barbados and average family size in the United States with a correlation coefficient (R) of -0.032 and weighted average of 3.32. Similarly, the statistical analysis conducted on geographies consisting of 196,383,417 people shows a mild negative correlation between the proportion of Immigrants from Scotland and average family size in the United States with a correlation coefficient (R) of -0.305 and weighted average of 3.12, a difference of 6.4%.
Average Family Size Correlation Summary
| Measurement | Immigrants from Barbados | Immigrants from Scotland |
| Minimum | 2.55 | 2.00 |
| Maximum | 4.08 | 3.97 |
| Range | 1.53 | 1.97 |
| Mean | 3.32 | 2.97 |
| Median | 3.30 | 3.03 |
| Interquartile 25% (IQ1) | 3.19 | 2.81 |
| Interquartile 75% (IQ3) | 3.47 | 3.13 |
| Interquartile Range (IQR) | 0.28 | 0.32 |
| Standard Deviation (Sample) | 0.29 | 0.36 |
| Standard Deviation (Population) | 0.29 | 0.36 |
Similar Demographics by Average Family Size
Demographics Similar to Immigrants from Barbados by Average Family Size
In terms of average family size, the demographic groups most similar to Immigrants from Barbados are Trinidadian and Tobagonian (3.32, a difference of 0.020%), Immigrants from Sierra Leone (3.32, a difference of 0.030%), Immigrants from Ecuador (3.32, a difference of 0.030%), Yaqui (3.32, a difference of 0.060%), and Immigrants from Micronesia (3.32, a difference of 0.070%).
| Demographics | Rating | Rank | Average Family Size |
| Immigrants | Cambodia | 99.9 /100 | #68 | Exceptional 3.33 |
| Immigrants | Immigrants | 99.9 /100 | #69 | Exceptional 3.33 |
| Immigrants | Trinidad and Tobago | 99.9 /100 | #70 | Exceptional 3.33 |
| Immigrants | West Indies | 99.9 /100 | #71 | Exceptional 3.33 |
| Immigrants | Caribbean | 99.9 /100 | #72 | Exceptional 3.33 |
| Yaqui | 99.9 /100 | #73 | Exceptional 3.32 |
| Immigrants | Sierra Leone | 99.9 /100 | #74 | Exceptional 3.32 |
| Immigrants | Barbados | 99.8 /100 | #75 | Exceptional 3.32 |
| Trinidadians and Tobagonians | 99.8 /100 | #76 | Exceptional 3.32 |
| Immigrants | Ecuador | 99.8 /100 | #77 | Exceptional 3.32 |
| Immigrants | Micronesia | 99.8 /100 | #78 | Exceptional 3.32 |
| British West Indians | 99.8 /100 | #79 | Exceptional 3.32 |
| Lumbee | 99.8 /100 | #80 | Exceptional 3.32 |
| Immigrants | Dominica | 99.8 /100 | #81 | Exceptional 3.32 |
| Ecuadorians | 99.8 /100 | #82 | Exceptional 3.32 |
Demographics Similar to Immigrants from Scotland by Average Family Size
In terms of average family size, the demographic groups most similar to Immigrants from Scotland are Russian (3.12, a difference of 0.020%), Immigrants from Australia (3.13, a difference of 0.060%), Bulgarian (3.13, a difference of 0.060%), Immigrants from Northern Europe (3.13, a difference of 0.090%), and Serbian (3.12, a difference of 0.090%).
| Demographics | Rating | Rank | Average Family Size |
| Slavs | 0.1 /100 | #308 | Tragic 3.13 |
| Northern Europeans | 0.1 /100 | #309 | Tragic 3.13 |
| Czechoslovakians | 0.1 /100 | #310 | Tragic 3.13 |
| Immigrants | Northern Europe | 0.1 /100 | #311 | Tragic 3.13 |
| Immigrants | Australia | 0.1 /100 | #312 | Tragic 3.13 |
| Bulgarians | 0.1 /100 | #313 | Tragic 3.13 |
| Russians | 0.1 /100 | #314 | Tragic 3.12 |
| Immigrants | Scotland | 0.1 /100 | #315 | Tragic 3.12 |
| Serbians | 0.1 /100 | #316 | Tragic 3.12 |
| Italians | 0.1 /100 | #317 | Tragic 3.12 |
| Eastern Europeans | 0.1 /100 | #318 | Tragic 3.12 |
| Welsh | 0.1 /100 | #319 | Tragic 3.12 |
| Immigrants | North America | 0.0 /100 | #320 | Tragic 3.12 |
| Immigrants | Austria | 0.0 /100 | #321 | Tragic 3.12 |
| Immigrants | Canada | 0.0 /100 | #322 | Tragic 3.12 |