Immigrants from Bangladesh vs Irish No Schooling Completed
COMPARE
Immigrants from Bangladesh
Irish
No Schooling Completed
No Schooling Completed Comparison
Immigrants from Bangladesh
Irish
3.1%
NO SCHOOLING COMPLETED
0.0/ 100
METRIC RATING
320th/ 347
METRIC RANK
1.4%
NO SCHOOLING COMPLETED
100.0/ 100
METRIC RATING
12th/ 347
METRIC RANK
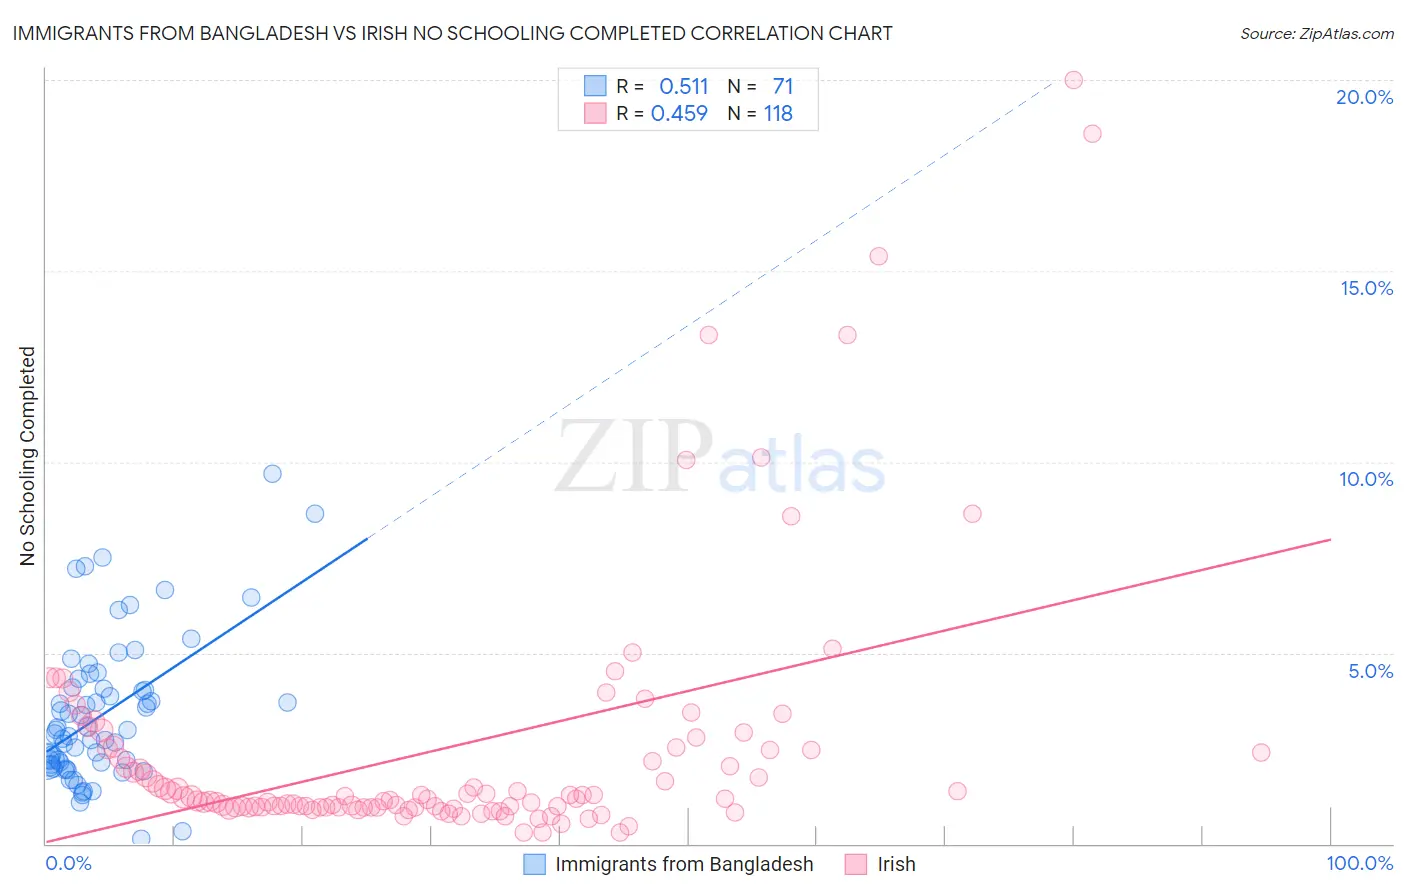
Immigrants from Bangladesh vs Irish No Schooling Completed Correlation Chart
The statistical analysis conducted on geographies consisting of 203,165,011 people shows a substantial positive correlation between the proportion of Immigrants from Bangladesh and percentage of population with no schooling in the United States with a correlation coefficient (R) of 0.511 and weighted average of 3.1%. Similarly, the statistical analysis conducted on geographies consisting of 558,904,841 people shows a moderate positive correlation between the proportion of Irish and percentage of population with no schooling in the United States with a correlation coefficient (R) of 0.459 and weighted average of 1.4%, a difference of 118.8%.
No Schooling Completed Correlation Summary
| Measurement | Immigrants from Bangladesh | Irish |
| Minimum | 0.13% | 0.30% |
| Maximum | 9.7% | 20.0% |
| Range | 9.6% | 19.7% |
| Mean | 3.4% | 2.5% |
| Median | 3.0% | 1.2% |
| Interquartile 25% (IQ1) | 2.1% | 0.96% |
| Interquartile 75% (IQ3) | 4.1% | 2.5% |
| Interquartile Range (IQR) | 2.0% | 1.5% |
| Standard Deviation (Sample) | 1.9% | 3.4% |
| Standard Deviation (Population) | 1.9% | 3.4% |
Similar Demographics by No Schooling Completed
Demographics Similar to Immigrants from Bangladesh by No Schooling Completed
In terms of no schooling completed, the demographic groups most similar to Immigrants from Bangladesh are Immigrants from Burma/Myanmar (3.1%, a difference of 0.040%), Immigrants from Laos (3.1%, a difference of 0.11%), Immigrants from Guyana (3.1%, a difference of 0.78%), Immigrants from Honduras (3.2%, a difference of 0.79%), and Vietnamese (3.2%, a difference of 0.98%).
| Demographics | Rating | Rank | No Schooling Completed |
| Hondurans | 0.0 /100 | #313 | Tragic 3.1% |
| Immigrants | Belize | 0.0 /100 | #314 | Tragic 3.1% |
| Immigrants | Nicaragua | 0.0 /100 | #315 | Tragic 3.1% |
| Immigrants | Ecuador | 0.0 /100 | #316 | Tragic 3.1% |
| Cape Verdeans | 0.0 /100 | #317 | Tragic 3.1% |
| Immigrants | Guyana | 0.0 /100 | #318 | Tragic 3.1% |
| Immigrants | Burma/Myanmar | 0.0 /100 | #319 | Tragic 3.1% |
| Immigrants | Bangladesh | 0.0 /100 | #320 | Tragic 3.1% |
| Immigrants | Laos | 0.0 /100 | #321 | Tragic 3.1% |
| Immigrants | Honduras | 0.0 /100 | #322 | Tragic 3.2% |
| Vietnamese | 0.0 /100 | #323 | Tragic 3.2% |
| Mexican American Indians | 0.0 /100 | #324 | Tragic 3.2% |
| Dominicans | 0.0 /100 | #325 | Tragic 3.2% |
| Indonesians | 0.0 /100 | #326 | Tragic 3.2% |
| Immigrants | Latin America | 0.0 /100 | #327 | Tragic 3.3% |
Demographics Similar to Irish by No Schooling Completed
In terms of no schooling completed, the demographic groups most similar to Irish are Lithuanian (1.4%, a difference of 0.030%), Polish (1.4%, a difference of 0.030%), Dutch (1.4%, a difference of 0.86%), Scotch-Irish (1.5%, a difference of 0.97%), and Tlingit-Haida (1.5%, a difference of 1.0%).
| Demographics | Rating | Rank | No Schooling Completed |
| Slovenes | 100.0 /100 | #5 | Exceptional 1.4% |
| Carpatho Rusyns | 100.0 /100 | #6 | Exceptional 1.4% |
| English | 100.0 /100 | #7 | Exceptional 1.4% |
| Swedes | 100.0 /100 | #8 | Exceptional 1.4% |
| Scottish | 100.0 /100 | #9 | Exceptional 1.4% |
| Dutch | 100.0 /100 | #10 | Exceptional 1.4% |
| Lithuanians | 100.0 /100 | #11 | Exceptional 1.4% |
| Irish | 100.0 /100 | #12 | Exceptional 1.4% |
| Poles | 100.0 /100 | #13 | Exceptional 1.4% |
| Scotch-Irish | 100.0 /100 | #14 | Exceptional 1.5% |
| Tlingit-Haida | 100.0 /100 | #15 | Exceptional 1.5% |
| Finns | 100.0 /100 | #16 | Exceptional 1.5% |
| Croatians | 100.0 /100 | #17 | Exceptional 1.5% |
| Danes | 100.0 /100 | #18 | Exceptional 1.5% |
| Alaskan Athabascans | 100.0 /100 | #19 | Exceptional 1.5% |